To all my readers and followers, although it has been a long time since I have made posts here in the NomadInvestor blog, I have actually been very active in value investing all these while, constantly learning more and doing more of value investing, and it has been an amazing journey.
The reason why I have been silent here is that I have moved on to partnering with a friend and producing content and sharing about investments in another platform — MoneyWiseSmart, where we provide online courses on investing and investment research, with the aim to share what we know about investment and financial education with the other people, and to grow our knowledge and wealth together.
If you are interested in learning more about investments, I strongly encourage and am delighted to invite you to follow us at the following channels. We share a lot of free useful content and also paid courses for those who want more. Cheers all 🙂
Trailer video for our first online course ‘Investing Fundamentals, Financial Statement Analysis and Business Valuation’ launched today (with attractive early-bird price until 9 January 2020): https://www.youtube.com/watch?v=afGiRXSs9Cc
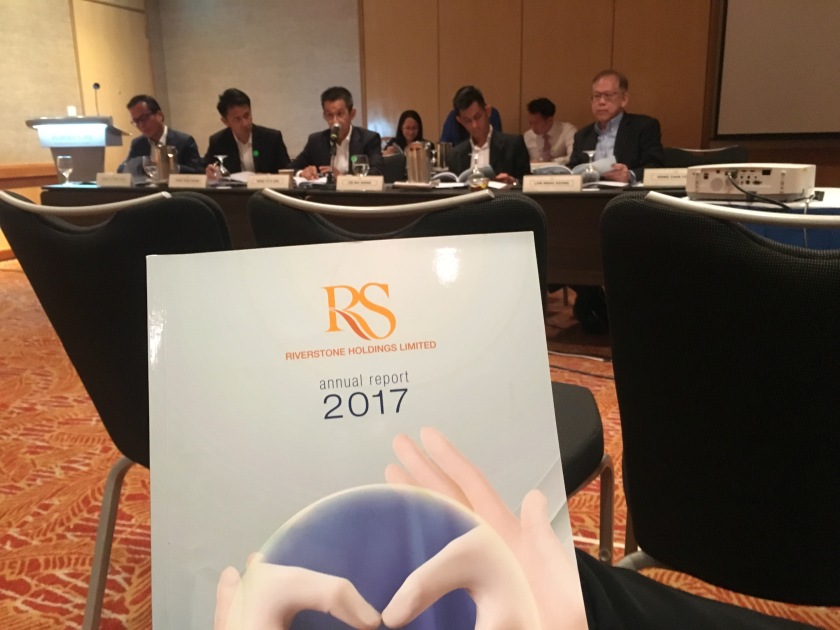
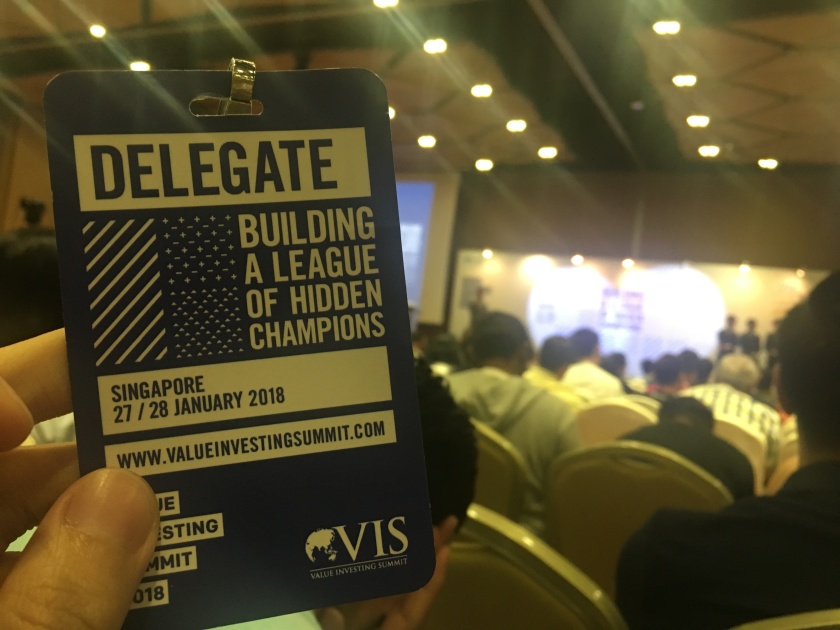
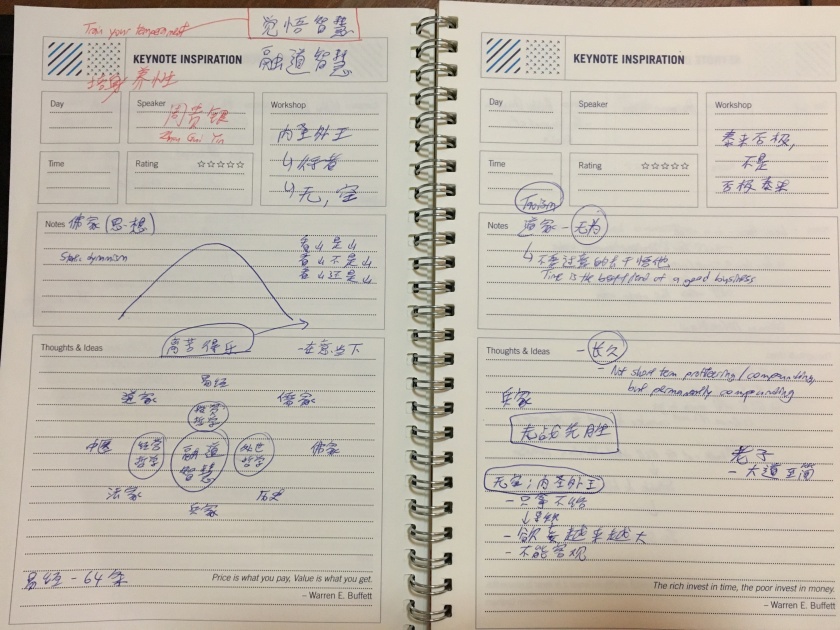
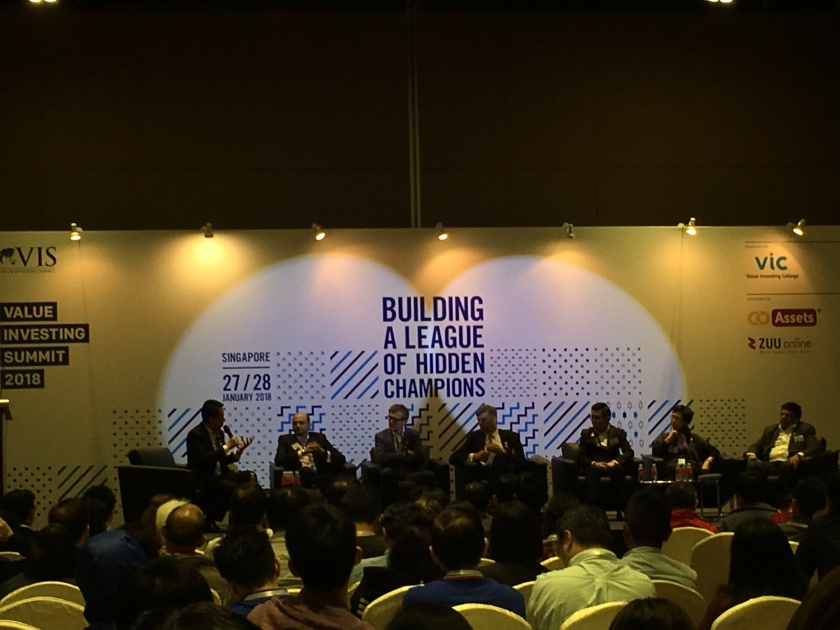
Over the weekend (19-20 January 2019), I attended Value Investing Summit (VIS) in Kuala Lumpur with my investor friends. This is my second time attending VIS (do check out my last year’s post here, if you haven’t), albeit on a sponsored media pass this time and at a place that required much travelling (I am based in Singapore).
This year’s learnings are more about simple time-old wisdom, but these are the ones that are true wisdom that stand the time, and I will be sharing just the key lessons here.
The summary is that:
figure our your investment philosophy and strategy, and have a good process (which I think most should have done so, if you have been investing and learning seriously for a few years); and
more importantly, execute that strategy and process with DISCIPLINE, ROBUSTNESS (don’t slack and ignore things that you know you should be thinking or finding out, but don’t due to indolence), a RATIONAL MIND and PATIENCE, bearing in mind the cognitive biases that human are prone to and always staying HUMBLE and ACT accordingly.
Investing is simple, but not easy. So remember to adopt a simple process and execute it seriously.
Take a simple idea and take it seriously – Charlie Munger
Now, let me turn to some of my learnings in more detail (by speakers), which probably might shed more colour on what I mean.
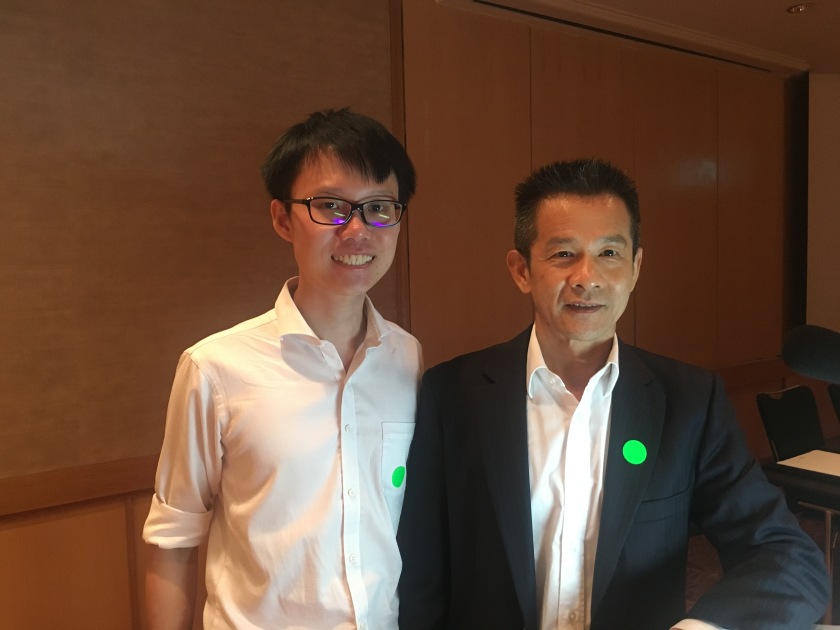
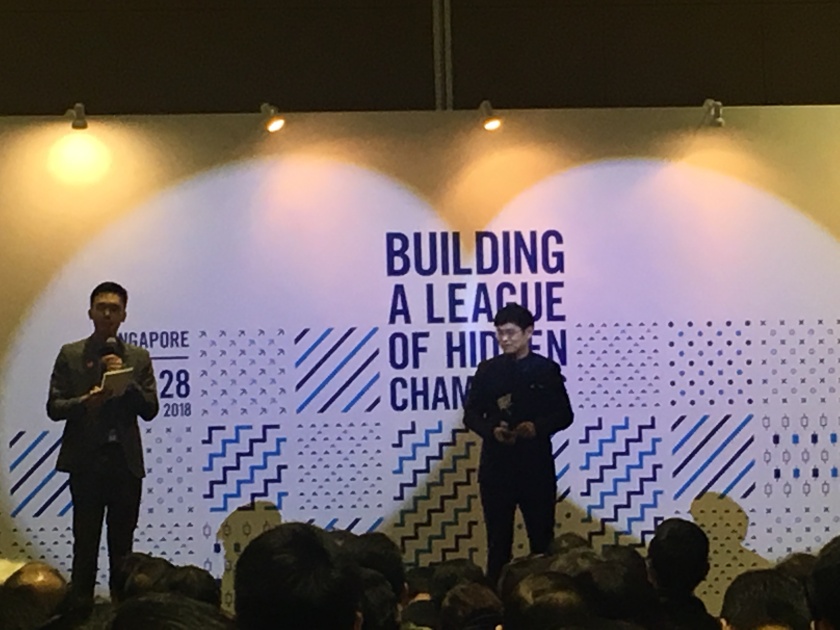
Vishal Khandelwal (Safal Niveshak)
First, the one year challenge! (I am looking older, but he is the same LOL)
Vishal is a fan of reading and re-reading and re-reading the supertext, instead of reading more and more new things. And hence the lessons that I got reminded from him are those simple time-old wisdoms, which despite simple are very important and impactful.
The points that struck me this year mainly relates to:
the importance of having that margin of safety ALWAYS;
thinking more about and focusing on the risks (that can lead to capital loss) than chasing for upsides (if you take care of your downside SERIOUSLY, the upside will come) – Remember: Getting to the top is optional. Getting down is mandatory;
not taking risks that can wipe you out, like the Russian roulette game;
not losing money (the other speaker, which I discuss later, have just 3 down years out of 22 years, which allowed him to keep compounding well); and
always being conscious and truthful about you own circles of competence and the boundaries of them, and being humble enough to stay within those circles (that’s a higher probability way of having your thesis right, which in turn hopefully leads to higher chances of earning money).
I know we hear this often enough, but there’s a reason why it is constantly repeated by the Oracle of Omaha. So it’s worth reminding ourselves again until we have it fully imprinted like a tattoo for life (just kidding).
Rule #1 – Never lose money. Rule #2 – Never forget rule #1. (And don’t be a swelled head!)
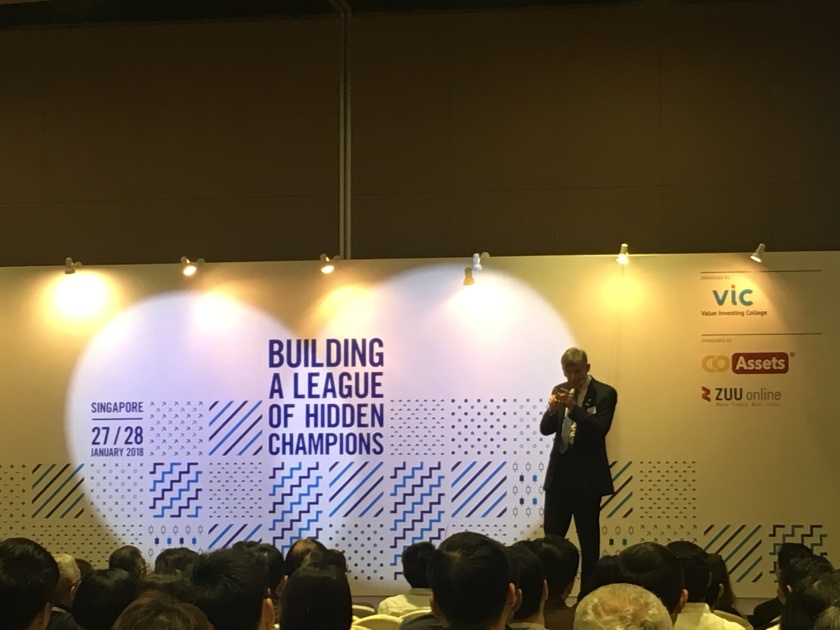
Dr Niwes Hemvachiravarakorn (The Warren Buffett of Thailand)
This is my first time meeting and hearing from Dr Niwes – a very funny and down-to-earth guy indeed, despite having over USD 200 million, after compounding it accidentally from USD 600k for 22 years at a CAGR of 31%. Impressive track records, regardless of whether luck played a role (as he claimed)!
Dr Niwes’ strategy and process are very simple and clear, which I think those who have read intensively in the investing field would have already come across very similar things multiple times.
What makes him successful in my opinion is his ability to execute it well, sticking to the stock selection process with discipline and RIGOUR, and sticking with his SUPERSTOCK companies for long enough with PATIENCE and CALMNESS, which are simple but not easy things to do, requiring a very strong control over temperament and having a rational and dedicated mind.
His strategy and points are very simple, and largely similar to mine.
Investing and getting rich is simple and can be simple;
ONLY invest in Super Stocks (hold more than 5 years, aiming for 10 baggers in 10 years), or Super Cheap Stocks (but not in dying industry or with declining profits);
Less than 20%-30% average annual turnover (note: remember punchcard investing, or Mohnish Pabrai’s rule of a strict 3-year lock in upon purchase of a stock);
Look for Mega Trend industry, and the leaders in it, with (i) durable competitive advantages, (ii) virtuous cycles, (iii) good finance, and (iv) good price (P/E less than 30, and low market cap relative to total addressable market (TAM));
And let me repeat, ONLY invest in those, and stick to them strictly and ruthlessly (once you have defined and set up your process and criteria, STICK to them!); and
Just continue living and you will get rich (if you have bought the right companies).
And let me add on – The patience to hold these Super Stock companies through cycles, and give the benefit of doubt to the management (whom you have evaluated to have the ability to know what’s best for the company, in terms of strategy and capital allocation, based on their past track records for decades (and write down these points in black and white, so you know whether the points are really valid or not, and you can’t deceive yourself)) for them to strategise and execute in times of challenges (else you would miss out recoveries and continuous compounding of those companies).
So, please go into buying a company with the expectations that you are not aiming to sell it at the peak before its fundamentals deteriorate for long, but with the expectations of being able to sell it at maybe 70% of its top performance after allowing the company and the management some time to execute to navigate and emerge from the tough times (as no business would have smooth sailings all the time). In other words, before you sell, remember to give the management whom you have identified as excellent executives and capital allocators, and whom you trusted upon your purchase of their companies, some time to correct and execute in overcoming those tough times and crisis, just like what they have done successfully in the past (for multiple times).
Super Stocks! Super Cheap Stocks! Well said!
Overall, Dr Niwes’ presentation makes me believe, and remember, that a good simple strategy and process, when well executed by a dedicated value investor with discipline, can produce tremendous results and wealth over time!
So let us be those dedicated value investors. And do the hard work of executing with discipline and rigour! (Focus on the process, and the outcome will come)
These thoughts of mine that occurred to me then made me think hard about the quality of the companies that I own, on whether they are Super Companies (I would prefer to call them so, then Super Stocks which probably are more catchy) and whether they have the top of the cream qualities on all aspects. So that I don’t sacrifice quality and the opportunities to hold only the real good companies on almost all aspects – if they don’t make the top tier, cut them, and keep turning the stones until you find the top.
Reflecting on the companies I own, on their quality, on whether they are indeed Super Companies… I have found 10, or so I think at least, and I am looking for 10 more so that there are higher chances for a few of them being undervalued at various points of time~ (Please let me know if you have ideas :P)
I managed to catch Dr Niwes for a question that I had before he left, where I asked him, what are the challenges he faced throughout his journey of applying such a strategy. His answer was, not much (he had only 3 down years out of his 22 years journey – impressive! which I believe is achievable if you focus on and remember margin of safety, eyeing on the risks (not the upside), circle of competence and good balance sheets and business models), but probably the challenges were like what he had said, selling too early. And hence his advice, “Keep Calm!”
Me: Challenges? Dr Niwes: Nope. Keep Calm! (And live longer LOL) (Golden advice indeed)
(For record and reference only) Examples of Dr Niwes’ (past) Super Stocks:
CP All – He held since 2009 and would sell when it becomes the largest company in that industry
HM Pro – Sold few years ago, as he saw competition
BH – Best private hospital, with medical/ageing tailwind
BDMS – Same as BH
AOT (Airports of Thailand) – Sold
CPN – Biggest shopping mall
MINT – Hotel group
Other learnings
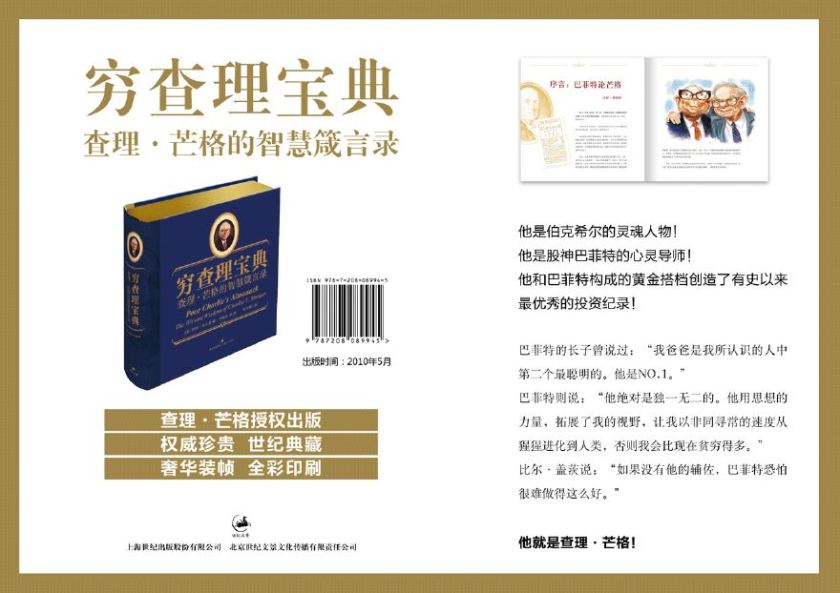
Charlie Tien, the founder of Guru Focus, read and re-read Buffett’s letters from 1950s to now for multiple times, which changed his life. He also made reference to Wilshire 5000 Total Market Index, to GDP ratio, as an indicator to look out for market cycles. Some of his ideas/companies include Church & Dwight (dealing with household products in the US) (note: seem to be a compounder and have reduced share count over the last few years), and Kweichow Moutai (bought first in 2014 at 8x P/E, when Xi Jinping became the leader and started on anti-corruption campaign).
Joshua Zhang, investment manager at HCF, on spotting (and avoiding) fraudulent and fishy companies, especially Chinese ones, which I think are very important in avoiding losses, so it’s an interesting and useful topic for me (e.g. on different ways to tunnel money out). And invert thinking can come in handy here.Sarah Fu 傅喻, the only Asian reporter to interview Warren for eight consecutive years and founder of 喻见 Media. Again, same resounding principle. Master one basic principle and follow it strictly!Jack Kouzi (or Jacuzzi) from Australia – Director of Strategy at VFS Group. Interesting top-down macro selection strategy, and views on Alibaba (including on its India expansion)China – The growing massive economyPanel Q&A. Question: Rebalance after a company becomes multi-bagger and big portion of portfolio? Vishal: Yes. I would keep all companies at <15% of portfolio by market value (he suffered major losses from his over-concentration of 80% in a stock that didn’t do well before). Charlie: Not really. I wouldn’t, but depends on company. (Nomad Investor: I am more, or totally, aligned with Vishal – no right or wrong, just personal preference)Joshua Zhang, investment manager at HCF, on spotting (and avoiding) fraudulent and fishy companies, especially Chinese ones, which I think are very important in avoiding losses, so it’s an interesting and useful topic for me (e.g. on different ways to tunnel money out). And invert thinking can come in handy here.
Some interesting case studies are:
HIK Vision – it has been in my list of companies to study for quite some time, and at this point I am still conscious of its overseas growth (due to sensitivity of security products) and wouldn’t include much of it in performing a valuation of the company for margin of safety.
Fast Retailing – Story sounds good, growth in international markets could be there, with moat (on use and advancement of technology and intangible assets), but ROE is not showing up as well.
Yihai – Interesting to learn about 张勇. Might have issues with payables and receivables.
So that sums up my key learnings for this year’s VIS~ Hope you have enjoyed the event and this post. And thank you to the organisers for extending the media pass to me!
Next year’s VIS would be in Kuala Lumpur again on 11-12 January 2020, so do check it out if you are interested~
P.S. And do feel free to discuss with me (by sending a message to Nomad Investor, or at my email at thenomadinvestor@gmail.com) if you have any ideas to go into my Super Companies list 🙂
P.S. And do check out another great article on VIS 2019 from MoneyWiseSmart here if you haven’t.
Finally got to see Mount Fuji when I was leaving the area on the last day~
Recently I went to Japan for a week for travel, in particular to Tokyo and the Mount Fuji area (Hakone – Gora and Fuji-kawaguchiko).
The first thing that stood out to me when I touched down on Tokyo Narita airport was that I saw Fanuc advertisements everywhere on the trolleys at the airport. Lol. Fanuc is a great company which I have analysed two months ago in August 2018, after a friend of mine brought my attention to it.
And the interesting thing that happened was that when I was in Japan, due to probably escalated concerns over US-China trade war and rate hikes, Fanuc’s share price came down even more, despite already crashing ~30% from the peak this year, which got me more interested.
So, here’s a brief write-up on Fanuc. And do visit my friend’s post on Fanuc too if you are interested.
Fanuc is the world leader in CNC (computer numerical control, i.e. the brains to control machines) and industrial robots. A Japanese company established in 1972 as a spin-off from Fujitsu, it is currently run by the son of the founder. It has commanded more than 50% (up to around 60%) global market share in CNC for decades and around 25% of global market share in industrial robot arms.
Let’s start with two videos that give an overview of Fanuc and its products/services, first one in 2016 and second one in 2018.
Fanuc is one of the Big 4 of industrial robots (together with Switzerland-based ABB, Japan-based Yaskawa, and German-based Kuka). It’s prowess and leadership in industrial robots are both shown in the demand side (largest in CNC, largest in terms of number of robots installed, top 3 in various segments of robots, good branding and reception by customers due to good quality, reliability and service (it stocks much more inventory than the competitors, and it replaces a faulty part in the customer’s factory instead of repairing there, to reduce down time); and the supply side (it’s fabulous production model of producing standardized parts (including rejecting customers’ highly customized orders), building on proven past technology (instead of drastically new ones), to leverage on existing knowledge curve and reduce the number of parts involved, issues with reliability and changes to production lines.
These are shown in its operating margins north of 30%-40% (comparable or even higher than Apple even though it is asset heavy!), significantly higher than the other Big 3 that has between 4%-12% operating margins. What’s more is that Fanuc achieved this on slightly lower selling price of its products than its competitors. So Fanuc’s products, although not using the most innovative technology, are cheaper, proven, reliable, and come with good service (lifetime management and at least 25 years of spare parts available, even for parts for machines no longer produced). And reliability and good and fast services are very important in production plants, where downtimes can cost a bomb (can be tens of thousands of dollars per minute for some customers).
Fanuc has achieved what GM and GE set up to achieve many years ago, to automate the factories worldwide, but failed terribly (after spending lots of money and high-performance management resources), and are now partnering with and helping Fanuc to sell its products (and using them too). Fanuc’s production plants are mainly in Japan (mainly around Mount Fuji – where Fuji eruption is quite a significant risk that can wipe out its factories) and some of them are lights-out factory, i.e. no lights and air-con are turned on because there is no one inside the factories (it’s just lots of robots producing lots of robots, to the extent that the mother robot has to be tied with clear markers so people know which robot is producing which, given the fast speed of movement of robots).
Industrial robots market is picking up now, projected to grow at ~15% for the next few years (so there is sufficient tailwind for the leaders, with increased pie shared by them), given improvements in technology and increase in labour costs in leading manufacturing countries (especially in China, where robot density per production worker is still extremely low). And deep learning, AI and IoT are picking up, and Fanuc has a head start in 2016 (with Cisco, Rockwell Automation, etc), in terms of linking all the robots and machines in its customers’ factories to collect and process all the data (to predict when a robot is going to go down, and thus scheduling maintenance promptly, reducing downtime), and improving the yield of the robots (by using AI to make the robots learn how to do things better and coordinate with other robots).It’s FIELD system is an open platform, akin to the App Store on your smartphone, where developers can develop app for different use of the robots or machines linked. And its ZDT (Zero Down Time) application has already been adopted by its customers and saved them millions of dollars of cost savings.
Albeit having a ROIC of 25%-40% (excluding its massive cash of ~JPY 800b (no debt), which is more than half of book value equity), and having just spent massive amounts of capex for factory and production lines expansion in the past 3 years (of ~JPY 100b per year, dwarfing the ~JPY 30b of capex per year in the previous 7 years), in view of the strong current backlogs of orders and future orders, the market has priced Fanuc lower, sending its price down >40% from the peak early this year, and back to 2015 level, due to concerns of slowing down of smartphone sales (of which the robots that help to make smartphone components, including Apple’s metal casings, are about 1/3 of Fanuc’s total revenues) (and probably due to concerns over US-China trade war). This part of Fanuc’s business is tied to the cyclical smartphone cycles, but its order books for other products are still going strong, and in the long term the cycle would go up and down regardless, with an overall structural uptrend.
I see Fanuc still growing (and leading together with the other 3 of Big 4) in the next 5-10 years, riding on this structural uptrend in industrial robots and automation happening around the world (even SE Asia countries, with relatively lower labour costs) are also adopting them now).
At the current market cap of ~JPY 3.7 trillion, this implies an EV of ~JPY 2.9 trillion, so a EV/NOPAT of about 14x FY2015 (ended Mar) NOPAT (its good year), 23x FY2017, 16x FY2018, or 20x FY2019 (management forecast as at Jun 2018, which is lower than previous years due to slowdown in IT-related industry this year. However, its forecasts tend to be conservative, with it outperforming in the end).
Which can be attractive, from a long-term investor’s perspective, for a high ROIC market leader (3x-10x greater operating margins than largest leading peers based on their firm-wide overall margins (instead of specifically on comparable business segments) with sufficient runway in a market with strong tailwind run by a focused founder-family-management with more than five decades of experience (during the financial crisis in 2009, it shut down its communications with investors, because it wanted to focus on the operations of the business, which some might deem not good).
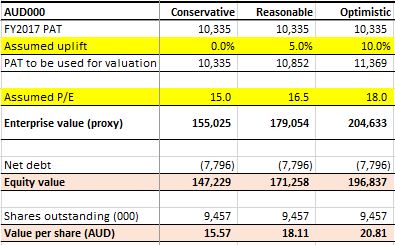
I personally think Fanuc could reasonably be worth around JPY 3.9-4.5 trillion, or JPY 20-23k per share, and could compound its value at 17-20% a year for the next 5-10 years, based on the reasonable and optimistic scenarios in my valuation below.
My valuation of Fanuc (as at October 2018)
Another interesting development is the acquisition of German-based Kuka by Chinese Midea Group in 2016/2017, after Midea failed to get its hands on Japan-based Yaskawa. After that event, the German auto manufacturers have been gradually switching out Kuka’s robots which are dominant in the German market, to other players including Fanuc, due to concerns of the Chinese obtaining all the data and know-how of German auto production processes (the robots and machines are now collecting almost all info, so if one gets its hand on the robots, it has a lot of data). So even though Fanuc might face tougher competition from Kuka in the Chinese market (which is growly rapidly and has more than enough pie for everyone I believe), it actually benefited a lot from the German market (and it is expanding its European operations there now aggressively), a market with the 2nd or 3rd highest robot density per manufacturing worker in the world (after Korea).
Admiring Mount Fuji, and contemplating the future of Fanuc~ (Mount Fuji please don’t erupt lol)
Hope you have enjoyed the post and Mount Fuji. Do let me know if you have any comments or insights on Fanuc or this industry 🙂
Capilano Honey, a company which I partially owned since January this year, received a take-private offerearly this week. This becomes the second take-private offer I received in my investment journey, after GLP in 2017.
The price? Cash offer of AUD 20.06 per share , translating to equity value of around AUD 190m, with the option to receive scrip shares in the new entity. This offer price represents a 28% premium over the last close price (AUD 15.65) and implies a FY18 P/E of 19.3x (on earnings which I consider to be still depressed) and FY18 EV/EBITDA of 12.5x.
The buyer? A private equity group (Wattle Hill), co-founded by Albert Tse (the husband of Jessica Rudd, daughter of former Australian prime minister Kevin Rudd… LOL), specialising in China-focused agricultural exports.
At the same time, Capilano also released its FY2018 results, which were quite good in my opinion.
Revenue increased by 4% to AUD 139m;
Operating profit increased by 19.6% to AUD 14.0m (disregarding the one-off non-operating capital gain of AUD 2.1m last year); and
Honey stock further improving to 6,746 tonnes from 5,953 tonnes last year with better season (although Eastern Australia started seeing increasingly apparent dry conditions in recent months).
Kerry Stokes, who has 21% voting power via Wroxby Pty Ltd, has already indicated to vote for scrip consideration and the deal is likely to go through.
The offer valuation of AUD 190m lies towards the upper range of my valuation of AUD 170m to AUD 200m made in January 2018. And I feel that the offer price could have been a bit higher, at around AUD 200m or even slightly more (given the benefits that the buyer would accrue, from recovery in earnings and likely expansion into China utilisting their expertise and networks).
I purchased it at AUD 18.60 per share, or AUD 176m for the whole equity. And I received a dividend of AUD 0.34 per share in July, so this should imply a return of approximately 10% [= (AUD 20.06 + AUD 0.34) / AUD 18.60 – 1].
But my returns? It depends largely on how AUD performs against SGD in the coming months.
For now, assuming I hold it till take-private happening in 5 December this year and AUD-SGD remains at the current rate of 1.0x till then, my returns would be a mere 1.7% (after taking into transaction fee, of a whopping AUD 75 (or 2% of my purchase cost) from OCBC Securities, which I discovered it to be this high only after I received the transaction statement – I thought it would like in the range of AUD 25 similar to other markets, but lesson learned).
If lady luck is with me, and AUD appreciates back to 1.06 SGD (the rate I purchased in January) by December, then my return would improve to 7.4% (for 10 months), or annualised rate of 8.4%, which is sub-par and below my expectations. Nevertheless, still a good and interesting ride and a first attempt in buying an Australian company.
Given that I am based in a foreign country outside of Australia, with my shares purchased through custodian by my brokerage firm, opting for scrip in the new entity would be risky and unwise for me in my opinion.
So for now, all I have to do is wait for the privatisation to happen end of this year and hope for an appreciation in AUD (I’m unlikely to sell before that, to avoid incurring the whopping high transaction fee charged by OCBC Securities again) (or hope for someone else to come in with a higher bid, which would be a blue moon LOL).
To end my journey with Capilano (I have been following Capilano hashtag on Instagram, joining Australian beekeepers forum on Facebook, checking out Capilano’s products whenever I am in a supermarket, etc), let’s hear back and enjoy this catchy Capilano song! (scroll to 14:53)
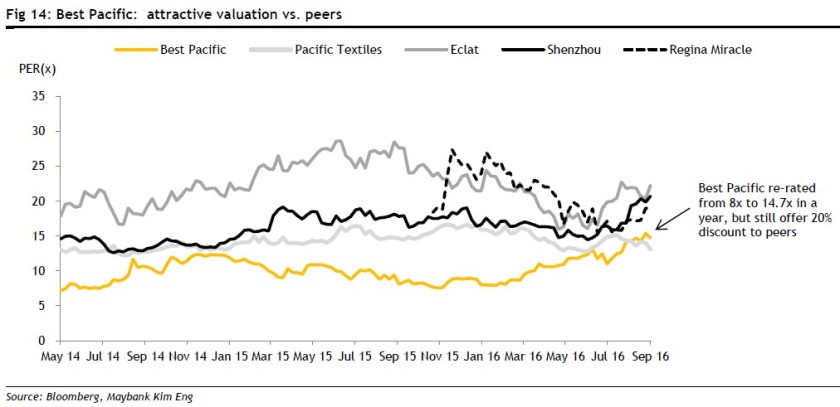
Company name: Best Pacific International Holdings Ltd (“Best Pacific”)
Stock code: HKG: 2111
Market cap (as at 14 July 2018): HKD 2.4 billion
Average daily traded value: HKD 0.9 million
1. Executive summary
Best Pacific is a China-based textile manufacturer of high-performance lingerie and sportswear materials, with a focus on elastic fabric, elastic webbings and lace. It is the world largest lingerie materials manufacturer, supplying to renowned lingerie brands (e.g. Victoria’s Secret, Triumph, Wacoal, Maniform, Aimer, and Spanx) since 2003, and is increasingly expanding its sales to global sportswear brands (e.g. Under Armour, Lululemon, Adidas, Puma, 2XU and Sweaty Betty) since 2013.
Best Pacific fits my investment criteria – a good company with strong lasting moat (Criteria 1), high returns on capital (Criteria 2) and sufficient reinvestment opportunities (or growth runway) (Criteria 3); run by decent/good management (Criteria 4); and available at reasonable/attractive prices (Criteria 5) – and therefore constitutes one of my key holdings which I intend to hold for long (five years or more, as long as the fundamentals and my thesis remain intact).
The following sections set out:
an introduction of the company;
details and my views of the company, in terms of:
its moat (criteria 1);
its return on capital (criteria 2);
its reinvestment opportunities (criteria 3);
its management (criteria 4);
the risks associated; and
its valuation (criteria 5);
some concluding thoughts.
2. Introduction
Overview
Best Pacific was founded in 2003 by two textile veteran, Mr Lu Yuguang 盧煜光 (current executive chairman) and Mr Kane Zhang Haitao 張海濤 (current CEO), and was listed on HKSE on 23 May 2014, raising around HKD 530m.
In 2004, it began its operations in Dongguan, China, manufacturing and selling elastic fabric products to lingerie players. Subsequently, it progressively expanded its operations, and six years later it started launching more product categories – elastic webbing products (2010) and lace products (2012), becoming a one-stop supplier of the major material components of a typical bra.
In 2013, leveraging on its expertise and knowledge in elastic materials (elastic fabric and webbing), it expanded into a new high-growth market – the sportswear materials market, and the management intends to grow this business segment to a size larger than that of lingerie.
History and development of Best Pacific
Source: CICC 2016 report.
Business model
Best Pacific mainly engages in the manufacture and sales of elastic fabrics, elastic webbing and laces.
Unlike an ordinary OEM (original equipment manufacturer), it works in close partnerships with (i) the lingerie/ sportswear brand owners, (ii) the mid‑/ down-stream garment manufacturers and (iii) the raw material (fibre/ yarn) manufacturers, to apply the market intelligence it gains from them and its own R&D activities in designing its products. This R&D activity, innovation capability and close partnership with other stakeholders in the value chain differentiates Best Pacific from a normal OEM/ ODM (original design manufacturer).
Best Pacific’s value chain and business model
Source: IPO prospectus.
In addition, Best Pacific specialises in producing fabrics using synthetic fibres, in its case nylon and spandex (or also known as elastane globally outside of the U.S., or associated with Lycra which is a common type of spandex invented by DuPont), instead of natural fibres (e.g. cotton and wool). Synthetic fibres have certain advantages over natural fibres, for e.g. cheaper, lighter, more durable, have more strength, and offer more colours, textures and other properties (water resistant, quick to dry, super elastic, anti-bacteria, etc), and there has been increasing use of synthetic fibres (which have a shorter history) in the market. However, compared to natural fibres, they are much more difficult to dye, which is a key process in the production, and therefore requires a certain level of know-how and skills. Thus, contrary to the general impression of commodity-like textile manufacturers, Best Pacific competes not just on price, but also on technology, know-how, innovation and quality in the synthetic materials field.
Properties of different fibres
Source: Oriental Patron 2015 report.
On the lingerie segment, a unique point about Best Pacific is that it is not only the largest lingerie materials provider in the world (more on market and competitors later), but also one of the few players that provide one‑stop solution for the three (of four) major components of a typical bra, in terms of cost – elastic fabric (29%), elastic webbing (21%) and lace (16%). It does not deal with molded foam (22%), but there has been increasing popularity of bralettes which do without molded cups, so for those products Best Pacific is able to supply almost all the components required.
Components of a typical bra
In terms of pricing, Best Pacific generally adopts a cost plus pricing model, which according to the company has enabled it to maintain a relatively stable gross profit margin.
So, in short, Best Pacific’s business model (which allows it to extract economic rents) is that:
it procures textile raw materials and converts them into fabrics which it sells to garment manufacturers or brands, pricing them on a cost-plus basis (where possible) and therefore isolating itself from any changes in raw material costs;
it adds value in the process of converting the materials into fabrics, where it utilises and leverages on its PPE base, know-how/skills/technology to understand the market requirements/trends and produce good quality fabrics and innovations (in terms of raw material innovation and end product innovation) that it has developed over years of R&D, market research and close partnership/relationship with its customers and suppliers. It also adds value on the lingerie segment in terms of being a one-stop supplier of the major components of materials, allowing for easier procurement, quality control and consistency and shorter lead time. These are the main value-adding aspects of Best Pacific, which allow it to earn decent/superior gross profits (ressulting in economic rents); and
it imposes (financial and operational) discipline on itself to control/ minimise the operating costs of the business, for e.g. by controlling labour costs, adopting automation both in terms of production and warehousing inventory control, strategically locating its production facilities close to customers to reduce logistics cost and lead time, etc. In my view, this is a hygiene factor that Best Pacific has to achieve, which does not allow it to extract additional economic rent (since peers would do the same, and in fact can probably do better due to their larger sizes and greater customer concentration (resulting in less distribution costs) and earn above-average return on capital.
Operations
Best Pacific has the following visions and missions (based on its 2017 annual report):
Vision: “Build on innovation and technology” has always been the Group’s vision in developing new products to meet the market demand. Through its dedication in research and development, the Group has developed a diversified portfolio of high-performance lingerie, sportswear and apparel materials, which are blended with quality, comfort and functionalities.
Mission: While Best Pacific is expanding and diversifying the customer portfolio with its innovative products across the sectors, we also focus on delivering our social responsibilities and the Group has always aimed at creating a green, healthy and safe working environment, while at the same time educating and equipping our staff with the relevant skills and knowledge to manufacture safe and quality products. Best Pacific not only sees the mission as part of our high corporate governance and social responsibilities, but also considers it a crucial element for the long term sustainable development of the Group.
In terms of operations, Best Pacific has been based in Dongguan, China all the time, until it expanded into Vietnam (2016) and Sri Lanka (May 2018). As at the end of 2017, it has 6,409 full time employees – 91% (5,859) in China and 9% (550) mainly in Vietnam.
In terms of products, Best Pacific produces three product categories – elastic fabric, elastic webbing and lace.
Best Pacific’s products
Source: Company website.
Source: Company website.
Customers
Since its operations in 2004, Best Pacific has gradually secured several global renowned lingerie and sportswear brands and developed close relationships with them (which in my view goes to showing its quality products and strong capabilities).
Some examples of customer sign-ups include Triumph (2004), Marks & Spencer (2005), Victoria’s Secret (2007), Wacoal (2008), Under Armour (2012), LuluLemon (2013), Adidas (2013), 2XU (2016), Sweaty Betty (2016) and Uniqlo (2018 – tentative, as I have not been able to confirm this yet).
Currently, it has a broad customer base of over 300 customers (according to a 2017 report by Huatai Financial).
Best Pacific’s customers
Source: AlphaLab by Fifth Person.
Source: AlphaLab by Fifth Person.
Source: Maybank 2017 report.
However, Best Pacific has a few key customers that constituted a major portion of its sales, in particular Victoria’s Secret (around 25% for both lingerie (12%) and sportswear (12%)), Under Armour (4%), Calvin Klein, Marks & Spencers, Wacoal and Triumph; and is therefore exposed to the sales performance of those customers. This level of customer concentration, however, is low relative to a few of the other strong competitors/peers (e.g. Shenzhou International and Pacific Textile – more on competitors later) which can have ~70%-80% of sales concentrated in top 5 customers.
Details of Best Pacific’s customers
Source: CICC 2016 report.
Source: Maybank 2017 report.
The images below provide a better idea of the type of end products sold by Best Pacific’s customers.
Products sold by Best Pacific’s customers
As seen in the figure below (based on 2014 financials), the sportswear brands that Best Pacific works with has relatively high gross profit margins (>45%), which are potential indicators of powerful brands with a certain level of pricing power.
GPM of sportswear brands (2014)
Source: Oriental Patron 2015 report.
Assets & production
As at end 2017, Best Pacific had total assets of HKD 4,215 million (based on book value), with the majority being:
PPE – HKD 2,277m (54%);
Inventories – HKD 694m (16%);
Receivables – HKD 648m (15%); and
Cash and bank deposits – HKD 243m (6%).
The majority of its PPE (HKD 2,277m) was:
machinery (HKD 1,309m or 58%);
buildings (HKD 551m or 24%); and
construction in progress (HKD 357m or 16%).
As seen in its asset base, Best Pacific is operating in a capital intensive environment, with more than half of its assets in PPE, of which around 60% of it is machinery. According to a Daiwa 2014 report, “Since the majority of the machines used by Best Pacific are state-of-the-art ones and are imported from Europe (Karl Mayer machines for elastic fabric and lace, Miller machines for lace), we expect machinery purchases to continue to take up the bulk of the Best Pacific’s capex budget.” The costs of these textile-producing machineries are not cheap (especially for lace). Based on data in the 2014 IPO prospectus, the (approximate) cost of one machine for:
elastic fabric was HKD 0.39m;
elastic webbing was HKD 0.23m; and
lace was HKD 5.32m.
In terms of production, the production process is capital intensive as it is highly mechanised, where the company processes nylon and spande into elastic fabrics, elastic webbing and lace (as shown in the diagram below). The production time from raw material to finished elastic fabrics and lace is ~2-3 weeks and ~1 week for elastic webbing, while raw materials are generally prepared three months ahead.
Production process
Source: 2014 IPO prospectus.
In terms of production facilities, the company has been increasing its capacity for all three product categories greatly over the last few years, more than doubling the capacity from 2013 to 2017 (i.e. a CAGR of 18% or more), partly due to increased capital from its IPO in 2014.
Best Pacific’s production capacity
Source: Annual reports.
Source: Huatai 2017 report.
International production footprint of Best Pacific
Source: Company 2017 results presentation dated 21 Mar 2018.
The diagram above depicts Best Pacific’s international production layout. Up until 2016, all of its production facilities were located in Donguan city in Guangdong province (and Jiangxi province) in China. On the Dongguan plant, China Securities International indicates in its January 2017 report that [emphasis mine]:
“Dongguan plant is running at 24 hours a day, with high labour retention rate. There are a total of 3,000 workers in the Dongguan plant, with production running 24 hours a day on 3 shifts of around 8 hours each. The average monthly wage rate is c. RMB 4,000, which is higher than the industry average. Also, a dormitory is provided in Dongguan’s city centre. As such, the worker’s retention rate after the previous Chinese New Year holidays was over 90%”;
“We are impressed by its high automation production process, making it nimble on capacity adjustment and least vulnerable to wage hike in China, which we believe will be one of its major competitive edges over a shortening order cycle”; and
“At present, its warehouse is operated manually. BP is planning to upgrade it to full automation in 2017. This is expected to enhance its production efficiency and the estimated cost is RMB 100mn.”
In 2016/2017, the company started constructing its first plant in Vietnam, in the VSIP (Vietnam Singapore Industrial Park) in Hai Duong, with a total investment of around HKD 600m, increasing the production capacity for elastic fabric and webbing by ~25%-30% (compared to end 2015). The plant was completed in mid 2017, with the trial production started in July 2017 and the first batch of production conducted in 2017Q3. As at March 2018, there was over 500 staff (~9% of total workforce) employed in Vietnam and the company expected to hire up to 1,200 local workforce in the near future.
According to the company, the reasons for the expansion of production in Vietnam include to leverage on the beneficial tax incentives and the cost savings from lower labour costs and logistic costs, and to be located nearer to its customers (e.g. Regina Miracle (IDM for Victoria’s Secret) and many other brands/garment manufacturers which have been moving their production from China to other countries like Vietnam since early 2010s (mainly in the wake of relatively higher labour costs in China).
Details of Best Pacific’s Vietnam plant
Source: Company 2017 results presentation dated 21 March 2018.
Source: Company 2017 results presentation dated 21 March 2018.
Source: Company 2017 results presentation dated 21 March 2018.
Source: Company 2017 results presentation dated 21 March 2018.
According to a CSI 2017 report, “BP is expected to derive cost savings from logistics (it no longer needs to ship its products to its customers in Vietnam), and lower labour and operating costs (which is 40% lower than PRC).”
Recently, in May 2018, Best Pacific also started a joint venture with Brandix (Sri Lanka’s largest end-to-end apparel solutions provider (with 55k employees vs Shenzhou’s 75k) and an existing long-term major customer of Best Pacific (with overlapping customer base, e.g. Victoria’s Secret and M&S, and other customers like GAP and A&F)) in Sri Lanka, Best Pacific Textiles Lanka (“BPTL”), to manufacture and sell synthetic textiles and textile related products.
The total capital contribution into BPTL would be USD 70m (or, less likely, USD 50m, based on a different source) from Best Pacific (75%) and Brandix (25%), with some in-kind asset contribution (including main factory building structure and store building structure) of USD 1.5m from Brandix. The JV will be managed primarily by Best Pacific and will produce fabrics (with a specific focus on warp knit synthetic fabric) and supply to Brandix, and Best Pacific would become the most preferred supplier.
According to a DBS June 2018 report, the joint venture would require a new plant and construction should finish by the end of FY18F, which would form a substantial part of Best Pacific’s capex for the year.
Details on Best Pacific’s joint venture with Brandix
Source: Company 2017 results presentation dated 21 March 2018.
A bit more about Brandix – It also has partnership with Pacific Textile (Best Pacific’s competitor) for a very long time since 2004, through a joint venture called Teejay Lankan Plc, which was listed in 2011 on the Colombo Stock Exchange and focuses on knitted fabrics for the intimate apparel and sportswear industries, with its largest clients being Victoria’s Secret, Marks & Spencer and Intimissimi. This joint venture was more of a cotton fabric producer, instead of synthetic, but has entered into the synthetic fiber segment (due to good growth and demand, and to be a comprehensive one-stop supplier) in 2017 (with acquisitions of companies with such manufacturing facility). However, the focus of the synthetic category is polyamite, different from Best Pacific’s nylon and spandex, so I see it as a different and indirect competition. In my opinion, it might be that Brandix does not have the experience/ capability to manufacture the right type of synthetic fiber, including in this JV with Pacific Textile (allthough I am not entirely sure now). Thus, it had to, or it chose to, partner with Best Pacific recently to go into the synthetic nylon and spandex categories. The fact that it chose Best Pacific, and not Pacific Textile or others, was a positive point to me.
In addition, on 4 December 2017, Best Pacific also entered into a joint venture agreement with MAS Capital (a direct wholly-owned subsidiary of MAS, which is a current major customer of Best Pacific with long-term business relationships, and a reputable leader in the industry of apparel and textile manufacturing with mature international operation systems) in relation to the acquisition of 51% of the total issued share capital of Trischel Fabric (Private) Limited from MAS Capital.
According to the 2017 annual report, “Pursuant to the MAS JV Agreement, the consideration for the acquisition shall equal to 51% of the net asset value of Trischel as at the completion date and, in any event, shall be no more than US$50,000,000. Pursuant to the MAS JV Agreement, the completion of the acquisition shall take place on or before 1 August 2018 or any other date as BPSL (Thulhiriya) and MAS Capital may agree in writing. After completion, Trischel will continue its existing businesses including, among others, the manufacture of warp and weft knitted fabric, and the importation of yarn and greige fabric and complementary accessories for dyeing and finishing for export. Up to the date of this annual report [around 20 March 2018], completion has not yet taken place and Trischel is still owned as to 100% by MAS Capital.”
Details on Best Pacific’s joint venture with MAS
Source: Company 2017 results presentation dated 21 March 2018.
According to a DBS June 2018 report, “BP should takeover the MAS JV in 2H17, which is an existing operating plant. BP has already deployed staff for this operation and minor profit contribution is likely within FY18F. The Brandix JV requires a new plant and construction should finish by the end of FY18F. The majority of BP’s capital expenditure in FY18F would be associated with this expansion.”
A bit more about MAS – It also owns (unclear ownership %) Stretchline Holdings, the largest lingerie elastic webbing maker (5.1% market share in global elastic webbing in 2012, versus Best Pacific’s 3.9%) based on a Frost & Sullivan research. Based on Stretchline’s website, it is the world largest and only branded narrow fabric manufacturer, with many (patented) innovations (LockSafe, Fit-J, BondeLast, Stay4Sure and Fortitube technologies, which are lock-knit, narrow fabric, silicone coating, or puncture resistant fabric wirecasing technologies).
Materials & suppliers
The primary raw materials that Best Pacific uses in its production are nylon and spandex (around 70% of all raw materials based on a Daiwa 2014 report). The company also sources dyes from the suppliers. The cost of raw materials form a large part of the company’s cost of sales, at around 50%-60% in the past five years (2013-2017). It purchases these raw materials mainly from suppliers in China, Taiwan, Hong Kong and other overseas countries, which are manufacturers and sourcing agents of nylon and spandex.
Based on the 2014 IPO prospectus, the company has had business relationships with its five largest suppliers (which constituted around half of its total purchases, which has seen come down to 36% in 2017) for long periods, ranging from four to 10 years. Based on a Daiwa 2014 report, the company’s main suppliers include:
Korea-based Hyosung (004800 KS) – Best Pacific partnered with Hyosung to launch a new range of fabrics with MIPAN Aqua X and creora Fresh (with moisture management, UV protection, comfort, fit and freshness from odour neutralising technologies) at ISPO Munich in February 2017;
Japan-based Asahi Kasei (3407 JP); and
Japan-based Toray Industries (3402 JP) – which has become a substantial shareholder of Pacific Textile in early 2018, the closest competitor of Best Pacific.
Based on my own research, I have also identified working relationships between Best Pacific and other suppliers, i.e.:
US-based Eastman Chemical Company (NYSE: EMN) – Best Pacific produces Naia-based fabrics which are hypoallergenic, breathable, have a silky luxurious drape and hand-feel, and have good printing properties; and
US-based Invista – Best Pacific has worked with Invista since its mill’s inception in 2003 and launched one of the first lines of commercially available Lycra Sport Power-Comfort-Energy (PCE) index-certified fabrics in mid 2017.
The prices of Best Pacific’s raw materials are affected by the prices of spandex and nylon, which are in turn affected by fluctuations in crude oil prices and the supply-demand economics in the market (e.g. economic crisis leading to lower demand and therefore lower prices, and oversupply in certain markets at certain times leading to lower prices). The chart below provides some idea of the prices of nylon and spandex in China, albeit for an outdated period.
Average price of nylon and spandex in China, 2008-2013
Source: IPO prospectus dated 13 May 2014.
In my view, Best Pacific is exposed to the fluctuations of raw material prices to a minimal extent only, because:
it sets its product prices on a cost-plus basis, so as long as it is value-adding (from its R&D and innovation and the quality of its products) and as long as the brands (of which most of them have quite high gross margins and branding/pricing power) or garment manufacturers are not facing tremendous headwinds, it should be able to pass on most (if not all) of the increase in raw material prices; and
according to a CICC 2016 report, “Prices of raw materials (spandex and nylon) are influenced by oil prices, while yarn providers hedge the fluctuations. The ASP has been less volatile vs. raw material prices in the past. Judging from historical financial results, the company’s sales have shown steady growth and do not fluctuate together with raw-material prices.”
This, in my view, is supported or evidenced by the company’s relatively stable and high gross margins in the past few years (2017 GPM was affected by other factors – more on the financials later), although these are historical records which do not guarantee that Best Pacific can continue to produce innovative and quality products to justify the price premium of its products.
Best Pacific’s gross profit margins
Source: Annual reports.
R&D & innovations
R&D is a big part of Best Pacific, in line with its core value of “Build on innovation and technology”. Historically, it has been spending around 2%-3% of its revenue, or HKD 38m (in 2013) to HKD 80m (2017) a year , on R&D activities.
For example, the 2017 annual report states “The Group is dedicated to catering to the changing market preferences by introducing innovative lingerie, apparel and sportswear materials. For the years ended 31 December 2016 and 2017, the Group’s research and development costs represented approximately 2.2% and 3.0% of its total revenue, respectively.”
In terms of R&D, the 2014 IPO prospectus states that “Apart from maintaining close relationships with lingerie brand owners to develop new lingerie materials, we also work closely with out major raw material suppliers, who are leading players in the nylon and spandex industries, to jointly develop new fabrics or materials in response to the evolving market demands. When a new material is jointly developed by us and the supplier, we may request the supplier to enter into exclusively arrangements with us for the supply of the jointly developed material, allowing us to capture the market demands for such new material on an exclusive basis and increase our market share in the global lingerie materials market. The costs associated with our collaborations with our suppliers on research and development are generally shared between us and the suppliers.” [emphasis mine] The company also has a design studio in Qingdao City in order to capture local talents and innovation since 2012.
As at the end of 2013, the R&D team consisted of 91 personnel who are led by Mr. Shi Jiangzhi 石蒋志, a member of the senior management team who has been an employee of the company for ~10 years then, and the company had registered for 30 patents in China which are material in relation to its business.
Three years later, as at the end of 2016, the R&D team has grown slightly to more than 100 personnel (based on a CICC December 2016 report) and the number of patents has at least doubled to more than 60, being a mix of design patents and fabric patents (as at December 2015, based on a Oriental Patron 2015 report). The R&D team is split into two teams, one working closely with the major raw material suppliers, who are leading players in the nylon and spandex (Elastane) industries to develop new fabrics and material, and another team focusing on other research and lingerie product designs. In terms of design, I have only come across data for 2013, where the company generated about a substantial 200 new designs in 2013.
Best Pacific’s R&D facilties
Source: Daiwa 2014 report.
Source: Daiwa 2014 report.
In addition, the company:
works closely with a French fashion consulting firm (since May 2012) to assist in design and advise on trends, colors, and choice of threads and materials for elastic fabrics, elastic webbing and lace products;
has also opened a School of Management and Administration in June 2016, “which aims to provide generic management training to employees of different managerial level, the first leadership and management training programme was launched during the year and external consultants have been engaged to give lectures to the relevant employees once a month since August 2016”; and
has also established a Institute of Technology and Research in June 2016, and during the year, “the Institute engaged external professionals in the textile sector to provide a series of lectures to employees of different positions. The lectures aimed to introduce updated garment design concepts, manufacturing techniques and other industry specific knowledge to the relevant employees, so as to strengthen their knowledge of textile technology and to provide them with updates on the innovation and trends of the textile and garment industry. There were a total of 60 employees from the design team, research and development team, sales team and production department attending the lectures.”
The company’s R&D activities has resulted in a few key innovations, as follows:
April 2011, Lingerie material for Victoria’s Secret: In April 2011, Best Pacific’s R&D team developed a material for bras that was granted a patent, and was ultimately selected by Victoria’s Secret for its Body by Victoria’s product line. By developing the material, Best Pacific was able to enter into an exclusivity agreement with Victoria’s Secret to supply the material to its designated OEMs from 2012 to 2014, which laid the foundation for more business.On a separate note, on Best Pacific’s relationship with Victoria’s Secret, according to a CICC December 2016 report, “Best Pacific International became a supplier of the brand [Victoria’s Secret] following a 3-year evaluation of the company’s R&D capabilities, and it now accounts for 50%, 60% and 25% of lingerie material, sportswear material and elastic webbing orders from Victoria’s Secret.” [emphasis mine] This, to some extent, shows the vigour of Victoria’s Secret’s evaluation process and the R&D capability of Best Pacific;
Mid 2013, Under Armour SpeedForm: In mid 2013, Under Armour launched its star SpeedForm running shoes (featuring flexibility, comfort, lightness and seamlessness) with the slogan “a bra for your feet,” signaling that core manufacturing technology could be shared between intimate wear and high- tier functional sportswear products. Best Pacific (together with Regina Miracle) was selected as the supplier of the cutting-edge materials for those shoes (the same materials that Best Pacific has developed for bras are now also being used in running shoes).A Daiwa 2014 report states that “To draw a parallel, we would compare Under Armour’s SpeedForm to Nike’s Flyknit footwear product, both of which are considered by the market as potential game changers in the footwear industry and as being highly innovative. The fact that Best Pacific beat other much larger and more experienced shoe makers like Yue Yuen to supply the SpeedForm running shoes is a testament to the company’s technological know-how, in our view. While SpeedForm was launched in mid-2013, Best Pacific was still the only supplier of SpeedForm to Under Armour at end-June 2014.” [emphasis mine]A quote from the 2015 Investor Day of Under Armour says it all: “We made shoes in a bra factory because it enabled us to do things that’s never been done before, by the level of fit and comfort that was unmatched and unobtainable in traditional footwear manufacturing facilities.” Best Pacific, joining hands with Regina Miracle, is part of this breakthrough; and
June 2017, Invista’s Lycra sport PCE (Power-Comfort-Energy) index: It was announced in June 2017 that Best Pacific, and another textile makers (Taiwan-based Eclat Textile), started integrating Lycra Sport’s Power-Comfort-Energy index criteria in their products.“In today’s global-competitive marketplace, innovation alone isn’t enough,” said Huw Williams, Invista’s global segment director, activewear and outdoor. “You also have to be able to clearly and concisely communicate to customers the advantages of fabrics employing a technology like Lycra Sport. That’s what the Power, Comfort and Energy index enables mills to do.”The new fabrics by Best Pacific leverage the recovery performance of Lycra Sport technology and Best Pacific’s high-gauge, double-knit construction to deliver a high stretch modulus that’s well suited for the high-growth active sportswear sectors. Kevin Zan, general manager of Best Pacific’s sports division, said Lycra Sport PCE, launched last year, has been a game changer when it comes to designing, producing, differentiating and selling performance fabrics.One year later, in July 2018, Best Pacific launched a new consumer-centric LYCRA® Bra Fabric Finder™ (BFF) at the Paris Mode City Show to help consumers pick the perfect casual bra. The new “BFF” consumer initiative builds on the original LYCRA® Bra Fabric Finder™ B2B program launched in 2017, which was created by INVISTA to help designers easily identify the best fabric construction and add functionality to any casual bra collection. While the list of participating mills is global, Best Pacific has built the most comprehensive collection of qualified fabrics.
Market & competitors
Lingerie (materials) market
According to a research by Frost & Sullivan, the global lingerie materials market was worth around USD 8.9 billion in 2015, and had been growing at around 5%-6% in the five years leading to that (2011-2015). Meanwhile, the output of China’s lingerie materials market was around RMB 15 billion (or ~USD 2.4b) in 2015, so around 25% of the global market.
Lingerie materials market size
Source: CICC 2016 report.
Source: CICC 2016 report.
The global lingerie materials market is highly fragmented, with a large number of Chinese and overseas players. The top five lingerie materials maker took up around 9% of the market (as at 2012). Best Pacific is the largest player overall (2.3%) and in elastic fabric (5.3%), and second largest in elastic webbing (3.9%).
Market share of lingerie materials makers, 2012
Source: Daiwa 2014 report.
The lingerie materials industry presents high barrier of entry to new entrants, mainly due to:
its capital and labour intensive nature, where large-scale investments in fixed assets, raw materials, technology, human resources and cash flow are required to achieve economies of scale. These investments include the capital investments required for setting up a factory and purchasing machineries with new technology, employing and fostering professional, technical and management personnel;
the high environmental compliance standards – with local and foreign countries attaching high importance to environmental issues, the production process involving emission of wastewater is regulated by government constraints and green barriers set by international purchasers. As a result, significant investments required for facilities to control emission of wastewater and compliance with green standards are also likely to pose difficulties for new entrants; and
the need to establish operating track record and trust with the customers, where client expansion is difficult for new entrants because it takes time to build trust with customers that demand stringent product quality and such customers have a tendency to purchase from established, qualified and authorised suppliers.
Sportswear market
Sportswear is a large and fast growing market in recent years, due to the trend to be more healthy and exercise more, and the ‘athleisure’ trend. Best Pacific’s 2016 annual report states that “global sportswear market was a supernova in 2016. According to Euromonitor International’s research report, the retail sales value is estimated to show a 7% compound annual growth rate (“CAGR”) from 2016 to 2020, as compared to about a 3.4% CAGR recorded between 2010 and 2015. “One in every six dollars we spend globally on apparel and footwear, we spend on sportswear”, quoted from a Euromonitor International’s research report, which implies the huge potential in the sportswear market and has reaffirmed Best Pacific’s intention to further expand our sportswear business.”
Overall textile market
The overall textile industry has undergone at least two major changes in the 2010s, i.e.:
manufacturers, both textile and garment, shifting their production bases out from China to other developing countries (e.g. Vietnam and Cambodia), in view of the rising and relatively higher labour costs in China – average monthly wage of USD 700-800 in China vs USD 250-300 in Vietnam (based on a Maybank 2017 report); and
industry consolidations, due to challenges in the industry, in terms of cost control and more stringent demands for shorter lead time (to cater to the fast changing trends) and better quality of production and materials (higher performance materials with various features), where the companies that are smaller or less efficient that could not adapt got squeezed out.
According to a Huatai June 2017 report, “Since 2010, many smaller OEMs have shut down operations due to industry consolidation, caused by the rise in labor cost and stringent requirements from brand owners in areas such as environment protection, child labor and work overtime rules. As of March, there are 19,740 enterprises in the textile industry in China, down 40% from the peak level of 33,218 in 2010. We believe the downward trend will likely persist as OEM manufacturers continue to shift to other locations with cheaper labor costs such as Vietnam and Cambodia. We understand that labor costs in some Southeast Asian countries are 50% lower than in China. Companies that can afford to relocate and those who can survive the industry consolidation are deemed survivors with strong potential to increase capacity and win orders from brand owners.”
China textile industry details
Source: Huatai 2017 report.
Competitors/market players
There are many players in the textile industry, with different characteristics, for e.g.:
upstream (yarns) vs mid-stream (fabric) vs down-stream (garment);
different focus/specialisation in terms of raw materials – natural vs synthetic fibres;
different production layout (in terms of the geographical bases); and
different business strategy, for e.g. in terms of customer concentration.
The diagram below provides a good overview of the textile value chain, and where Best Pacific sits in that chain.
Sportswear brands supply chain
Source: Oriental Patron 2015 report.
Within this textile value chain, I have a preference for the mid-stream players, as I see it as an area with potentially more companies with moats/ competitive advantages, instead of just a commodity player. Oriental Patron puts it nicely in its 2015 report, stating that “Fabric makers have the edge – We believe the fabric makers are more preferable as they are 1) less labour intensive, 2) more technological know-how is involved, especially in the dyeing process, and 3) less violable to any sudden changes in raw material prices, as they have greater bargaining power to pass on the costs. In fact, we can tell from the gross and net margins from the listed peers. The fabric makers’s average net margins outperformed at 11.8%.”
Textile and manufacturing chain
Source: Oriental Patron 2015 report.
As seen in the chart below, the mid-stream players, or the vertically integrated players (from up- to down-stream) generally have higher gross margins, which are indicative of higher pricing power (and potential ability to extract economic rent).
Gross profit margins of textile makers
Source: Oriental Patron 2015 report.
In terms of Best Pacific’s competitors, each of the players (including the mid-stream ones) has different charateristics and business dynamics than Best Pacific.
The closest competitor is probably Pacific Textiles, where they both deal with synthetic materials and have quite similar customer segments (both lingerie and sportswear) and production bases. However, Pacific Textile has lower gross margins, high customer concentration (Uniqlo and Victoria’s Secret) and low reinvestment activities (its dividend payout for past few years was 100% or more). More importantly, its annual filings have very limited information which basically make it difficult for me to understand the business and its developments, and I don’t want to own businesses that I can’t understand. However, it would be worthwhile tracking Pacific Textiles since it has some overlapping customers with Best Pacific, a different financial year end (March) and a JV with Brandix which is partnering with Best Pacific currently.
The diagrams below provide more information about the different players and their focus/ strength and customer base.
Regina Miracle is in more of the downstream side (albeit an IDM, innovative design manufacturer, which has some high value-adding activities too) and is a close customer of Best Pacific, producing the garments for Victoria’s Secret, Under Armour and other customers (Adidas, Reebok, Calvin Klein, Maniform, Champion, Bali and Warners). It has lower gross profit margins than Best Pacific, even though it is larger (should be the largest bra manufacturer with a ~1% global market share) and also spends more % (~4%)of revenue on R&D, probably due to its lower-margins downstream garment production activities. Even though this company appeals less to me, it is worth monitoring it given that it is a major customer of Best Pacific and shares similar situations with Best Pacific (similar customers and the expansion of production bases in Vietnam at an earlier time than Best Pacific).
Shenzhou International is another interesting player, where it is a very large (around 10x Best Pacific’s size) vertically integrated player with production bases in various locations (China, Vietnam and Cambodia). It has high gross and net profit margins too (comparable gross margins but higher net margins than Best Pacific due to lower operating costs due to a greater customer concentration (90% for Uniqlo, Adidas, Nike and Puma)), with high return on capital. Without having delved deep into Shenzhou International, I am sticking with Best Pacific for now (which I am satisfied with), partly due to its niche position in lingerie market which gives it a very strong hold in that market (Shenzhou does more of sportswear and general apparel, so less innovation involved, but has great advantage due to its vertically integrated model and fast lead time) and smaller size (thus benefiting from a smaller base effect). However, it’s a company worth exploring more in my opinion, as it would most likely benefit a lot from the industry consolidation.
Overall, I don’t see these big, renowned, or quality players as competing strongly with each other, as the industry is highly fragmented. The very weak or weak players would get squeezed out, which provide rooms for growth for the strong players that remain, and given that it takes time to expand and scale up production in this capital- (and for some, labour-) intensive business, there are still room for the strong players to grow in the next few years without having to compete heads-on with each other strongly. Thus, I don’t need to choose the best player, only a good enough player for my standards (this is not a winner-take-all market), that is available for purchase at a good price.
Financials
This sub-section sets out some summary financials of Best Pacific (more are covered later at the relevant places).
As seen in the table below, over the past four years, from 2013 to 2017:
revenue has grown relatively consistently at a CAGR of 14%, from HKD 1.7b in 2013 to HKD 2.8b in 2017;
gross profit has grown at a lower CAGR of 10% and profits at a mediocre CAGR of around 5% – This is mainly due to the underperformance in 2017 in terms of profits, which I consider is an one-off depression in margins due to the start-up phase of expansion in production facilities and operations in Vietnam. The first half of the year saw assets (machineries and plants, amounting to additional ~25% production capacity) and personnel (around 500 people, or 10% increase in total workforce) being built up with no revenues at all (and additional expenses due to hiring and training of personnel and other professional expenses), until the trial production in trial production in July 2017 and official first batch production in 2017Q3;
GPM and NPM have remained relatively high at ~30% (28%-34%) and ~15% (11%-19%) or more respectively, with lace products commanding the highest GPM (45%-50%), followed by elastic webbing (30%-35%) and elastic fabric (26%-31%); and
the mix of different product categories has remained relatively stable, with elastic fabric at around two‑third, elastic fabric one-third, and lace minimally at 3%-4%.
Best Pacific’s revenue, profits, profitability and growth
Source: Annual reports.
Meanwhile, production capacities have grown faster, at around 20% or more per year during the same period, while number of employees have grown by around 19%, but some of the new capacities and personnel have not been fully utilised yet.
Best Pacific’s operating data
Source: Annual reports.
In terms of geographical location of the direct customers (not the location where the end garments are sold to), the top three based on revenues are Hong Kong (declining to 34%), China (stable at ~25%) and Sri Lanka (slight downtrend to 15%).
Best Pacific’s revenue by geography (based on direct customer)
Source: Annual reports.
In terms of costs, total costs have been revolving around 80%-90% of revenue in 2013 to 2017, with cost of sales being 67% to 72% and operating costs being 15%-19%. There are some operating leverage for the company to tap on now at this point of time (with production capacities not being fully utilised, especially the new capacities, therefore rendering manufacturing overheads to be more of a semi-fixed nature), because as at 2017:
variable costs were around 55% of revenue; and
semi-variable costs were around 34% of revenue (with manufacturing overheads being 26%) (I have not treated any costs as fixed costs, even though they might be, to be conservative in thinking about operating leverage in a growing business context).
Best Pacific’s costs
Source: Annual reports.
In terms of balance sheet items, from 2014 to 2017 (2013 is not that meaningful as it was before equity raising via IPO and paydown of debt in 2014):
share base has increased only slightly (due to issuance of some share options) at a CAGR of <1%;
total equity and net book value has increased at a CAGR of 12%;
total assets and PPE have increased at a CAGR of 14% and (a much higher) 27% respectively, which shows the substantial expansion in production base; and
leverage has greatly increased from net cash position in 2014 to 43% net-debt-to-equity in 2017, due to the use of cash and take-up of debt to expand production facilities.
Best Pacific’s summary balance sheet
Source: Annual reports.
In terms of working capital, the cash conversion cycle has generally been stable, but was squeezed in 2017, due to increase in inventory days (due to brand customers demanding faster lead time, and stock up of inventory due to increased production layout in more locations) and reduction in payable days (to secure better pricing from the suppliers).
Best Pacific’s working capital cycle
Source: Annual reports.
In terms of cash flows:
quality of earnings have been pretty good, with net cash from operating activities being 130% to 175% of PAT in 2013 to 2015, although this measure dropped to below 100% in 2016 and 2017 due to greater increase in working capital requirements;
the company has been reinvesting its operating cash flows a lot into capex to expand the business and production facilities, with capex exceeding depreciation by a significant margin (sowing the seeds now and reaping the rewards in a few years time, when capex slows down and goes back to a more reasonable sustainable manner, although not happening in 2018 due to the capex scheduled for Sri Lanka expansion); and
the company distributes out about half or less of the remaining free cash flows as dividends, at around 25%-35% of PAT (in line with the indicated dividend policy of at least 20% payout), and uses the remaining amounts to build up cash and pay down debt (especially in 2013 to 2015).
Best Pacific’s key cash flows
Source: Annual reports.
3. Moat
Overall
A company with high return on capital is unlikely to be able to sustain that high level of return over a long time without a strong and lasting moat, and that is not the type of company that I want to own, hence my focus on moat.
In my view, Best Pacific has two types of moat – (i) a strong moat in terms of intangibles, and (ii) a weak (or less strong) moat in terms of efficient scale.
Intangibles
Best Pacific has the following intangibles which allow it to secure existing and new customers and orders, and extract economic rent or high return on capital:
close partnership and relationship with both the customers (lingerie and sportswear brands or downstream players (e.g. Regina Miracle)) and the suppliers (synthetic fibre producers) in gathering market intelligence and developing new (innovative) products, e.g. working with:
Invista since 2003, and launching Lycra Sport PCE index-certified fabrics in mid 2017, and launching a new consumer-centric LYCRA Bra Fabric Finder (BFF) for the designers in July 2018;
Victoria’s Secret since 2007, and developing a new bra material in April 2011, of which it entered into an exclusive supply arrangement with Victoria’s Secret for three years from 2012 to 2014; and
Under Armour since 2012, and (together with Regina Miracle) developing and supplying the materials for Under Armour’s star SpeedForm running shoes;
strong production and R&D capabilities, including track record:
evidenced by Victoria’s Secret’s selection of it as one of its main supplier (in fact, the largest) after a 3-year evaluation of its R&D capabilities and presumably its quality products, becoming the largest global lingerie materials maker in a short period of 10 years (it was already the largest when it IPO‑ed in 2014), and securing of major global brands including in sportswear despite its new entry; and
supported by its continuous large spending on modern machineries from European companies (of approximately HKD 0.2m-5.3m per machine, from Karl Mayer and Miller) (with the total PPE now worth HKD 2.3b at end 2017), and substantial spending on R&D (HKD 84m in 2017, or 2%-3% of revenue in the past few years, among the highest in the industry compared with other leading players) with a substantial team (>100 employees, or around 2% of total workforce);
a pool of innovation and design inventions and patents developed over the years – more than 60, in terms of both design and fabric patents, as at end 2016 (which doubled from the 30 three years ago in end 2013), and substantial amount of new designs every year (200 new designs in 2013); and
a certain level of branding within the industry, for its quality (and pricier) products – according a Daiwa 2015 report, its “market research with multiple players along the lingerie value chain shows that Best Pacific is known among its peers, suppliers and customers for its high-quality but often pricier fabrics” [emphasis mine].
These intangibles (relationship, R&D, product quality, innovations and branding) have allowed Best Pacific to secure existing/new customers and orders, and charged a premium on its products, evidenced by its high gross margin (the highest in 2015 compared to some leading peers), as shown in the figure below.
Leading textile players’ R&D expenses and profit margins
Source: CICC 2016 report.
Although Best Pacific has a strong moat in terms of intangibles currently, which is good, it is also important to figure out the moat trend for this moat, i.e. whether it would become stronger, remain the same, or become weaker in the future, say in the next 5 to 10 years.
In my opinion, Best Pacific is still up-ing its game in R&D and innovations, given:
its active decision to increase R&D spending (a higher 3.0% of a higher revenue in 2017, vs. the previous low 2.2%-2.3%, although this increase was partly driven by demands from the brands side);
its recent launch of Invista Lycra Sport PCE index-certified fabrics last year (mid 2017) and LYCRA Bra Fabric Finder (BFF) for the designers recently (July 2018) of which it has the most comprehensive collection of qualified fabrics among the participating mills; and
its recent strategic collaborations with leading downstream players in Sri Lanka (Brandix and MAS) to produce synthetic fabrics;
and therefore I think that this strong intangibles moat of Best Pacific should remain at least as strong, with optionality for an upward improvement.
Efficient scale
Best Pacific has a weak (or less strong) moat in terms of efficient scale in the lingerie segment, where the niche lingerie segment (with a much smaller total addressable market) has not been a focus of the larger textile players which focus more on the general apparel and/ or sportswear segment (with higher growth).
Best Pacific’s focus on this niche lingerie segment in the first decade of its founding has allowed it to become the leading players in the lingerie field, being the world largest lingerie materials maker (albeit still a small 2% to 3% overall market share).
As a result, as of now, Best Pacific is more established than the other players, both in terms of breadth (where it deals with all three major components of a lingerie – elastic fabric, elastic webbings and lace) and depth (know‑how, R&D, capital and PPE investments, and human capital required to run this business well). This presents a strong edge (and opportunities) for Best Pacific, because:
the new/less established textile players would have to fork out substantial capital and time to grow the lingerie business and build track record and relationship with the lingerie brands, which presents inertia and more challenges to them (as compared to Best Pacific); and
this allows Best Pacific to leverage its leading position in this lingerie segment, in terms of both breadth and depth/quality, to entrench itself further, secure more orders from existing/new customers and grow its market share, for example by cross-selling its different product categories to existing customers, and offering the solution of a one-stop shop of the major bra components which is valuable in an industry where shorter lead time, consistency in quality and specification (e.g. colour), and ease of procurement (to ensure smooth production/supply chain process) are important.
Market share of lingerie materials makers, 2012
Source: Daiwa 2014 report.
This moat in efficient scale, which led to Best Pacific gaining strong trust and relationship with its lingerie customers, has partly contributed to Best Pacific’s progress in cross-selling its products in the past few years (both within lingerie product categories, and across market segments (lingerie and sportswear)), as discussed in its annual reports:
2015: “Benefiting from its strong design capabilities and the strategy to cross sell to existing customers, the Group has started the lace transactions with the majority of its core customers, fully demonstrating the wide recognition and further consolidating the Group’s unique position as a one-stop solutions provider”;
2016: “Our one-stop solutions strategy will further benefit the Group from such trend as some of our major lingerie customers are also expanding their businesses into sportswear, creating further cross-selling opportunities for the Group”; and
2017: “With the effort of cross-selling of our team and our dedication in expanding our market share, the revenue of elastic webbing also reported an increase by approximately 13.1% to approximately HK$941.6 million during the year under review”.
In my view, given the (i) barriers of entry into the lingerie textile industry, (ii) lack of interest from the larger textile players to participate/compete in this niche segment, and (iii) potential consolidation of the industry due to challenges in terms of cost pressures and stricter lead time requirement from the brands, this efficient scale moat of Best Pacific should also remain at least as strong, with optionality for an upward improvement.
4. Return on capital
Historical return on capital
Best Pacific’s historical return on capital has been generally satisfactory and above my requirement (ROE of at least 15%), albeit it has only a short history of four years in terms of periods post-IPO (in 2014).
As seen in the table below, during the period 2014 to 2017:
ROA has been around 7% – 14%;
ROE has been around 13% – 24%, with:
equity multiplier of 167% – 183%, levered up mainly due to debt and payables (54% and 28% respectively in 2017);
asset turnover of 66% – 78%, where asset base is mainly PPE, inventories, receivables and cash (54%, 16%, 15% and 6% respectively in 2017);
net profit margin of 11% – 19% (GPM, EBIT margin and NPM of 28%, 14% and 11% respectively in 2017);
ROIC has been around 10% – 23%, with:
invested capital turnover of 80% – 130%; and
NOPAT margin of 12% to 20%.
Best Pacific’s returns on capital
Source: Annual reports.
In terms of returns on new capital, from 2013 to 2016 (i.e. excluding 2017 where major expansions were going on, of which the results were not fully shown yet – and depending on the success of execution of those expansions, the returns would be affected accordingly), the CAGR of of the different measures of returns on new capital was very satisfactory, where the CAGR of:
RONA was 21%;
RONE was 20%; and
RONIC was 35%.
Sustainable return on capital
Going forward, I expect that Best Pacific should be able to achieve overall ROE of between 15% to 20% or more. In terms of Du Pont components, I expect:
equity multiplier to come down to around 160% to 170%, due to paydown of debt and potentially reduction in payables % (if suppliers require shorter payment terms for better prices for Best Pacific);
asset turnover to recover from the 2017 level of 66% to 71% (average for 2014-2016), as the utilisation for new capacities ramp up; and
net profit margin to recover from the 2017 level of 11% to at least 16% (average for 2014-2016, which is lower than that for 2015 and 2016 of 17% and 18% respectively), as the depreciation and other manufacturing overheads (included in cost of sales) get spread over a larger volume/ revenue base as new capacities ramp up, and distribution expenses and administrative expenses come down as a % of revenue due to lower transport costs (to customers in Vietnam as there are plants now in Vietnam) and the semi‑fixed nature of administrative expenses coupled with growing revenue.
Based on the above, the ROE would be at least 18% to 19%, with further upside if NPM is greater than 16%.
This ROE of 18%-19% is reasonable compared to that achieved by other leading peers (see screenshots below):
Pacific Textile: 27% in 2014, and 30% in 2017 (estimated); and
Shenzhou International: 18% in 2014, and 22% in 2017 (estimated).
Details of Best Pacific’s peers
Source: Daiwa Nov 2014 report.Source: Maybank Jul 2017 report.
5. Reinvestment opportunities
In my opinion, there are sufficient opportunities for Best Pacific to reinvest its earnings to grow its business, moderately in the mid to high single digit growth rate for the lingerie business, and low to mid teens for the sportswear business.
As indicated earlier:
according to research by Frost & Sullivan, in 2015, the global and China lingerie materials market was worth around USD 8.9 billion (and had been growing at around 5%-6% in the five years leading to that (2011-2015)) and USD 2.4b respectively, with around 66% of them being the three components that Best Pacific sells (elastic fabric, elastic webbing and lace), so around USD 5.9b and USD 1.6b respectively; and
according to a Euromonitor International’s research report in 2016, the retail sales value of global sportswear market was estimated to show a 7% CAGR from 2016 to 2020.
To grow, Best Pacific can grow with the whole market which is growing at mid single digits, and take over some market share (including from makers using natural fibres, instead of synthetic fibres) in this consolidating industry (which is possible given Best Pacific’s good or leading position, especially when compared with those inefficient players without much competitive advantages or niche focus that get slowly squeezed out).
Best Pacific’s dividend policy is a minimum of 20% payout ratio and it has been paying out around 15%-35% in the past five years, averaging 27%.
I estimate that Best Pacific would be able to reinvest around 70% or more of its earnings every year for the next five years, and achieve a minimum ROE of 18%, and therefore a growth in net profit of around 13% (= 70% * 18%). Doing some calculations to see what this means:
Best Pacific earned around HKD 300m (2017) to HKD 450m (2016) in net profits, and I expect a profit level normalised for the start-up activities (on the manufacturing overheads costs) in 2017 to be around HKD 400m (see table below);
My adjustment of Best Pacific’s 2017 costs and profits
Source: Annual reports.
a reinvestment of 70% resulting in 13% growth means an reinvestment amount of HKD 280m (= HKD 400m * 70%) and increase in net profit of HKD 52m (= HKD 400m * 13%);
assuming a minimum net profit margin of 15%, the implied increase in revenue is maximum HKD 350m a year (i.e. similar to the increase in sportswear sales alone in 2017 of HKD 340m, or USD 45m); and
this USD 45m is minimal compared with the USD 6b of total addressable market on the lingerie side (i.e. < 0.1%) and a much larger market for the sportswear side (which uses more length of fabric per garment piece), so this increase in size seems possible and reasonable to me.
6. Management
Details
Best Pacific is mainly run by founder-owner-operators and two family members, as follows:
Lu Yuguang (盧煜光) (52), the co-founder (in 2003) and current executive chairman, who formulates overall management plans and oversees the strategic business development;
Zhang Haitao (張海濤) (48), the co-founder and current CEO, who formulates and executes overall corporate directions and business strategies;
Wu Shaolun (吳少倫) (53), Mr. Lu’s brother in-law and the current GM, who is principally responsible for the company’s infrastructure and the general management of Dongguan BPT and Dongguan NHE. Mr. Wu has been with Best Pacific since founding and was given a 5% shareholding in the company by Mr. Lu from his own shares for nil consideration in 2006 in recognition of his contribution to the growth in business; and
Zheng Tingting (鄭婷婷) (43), Mr. Zhang’s spouse and the current COO and vice-president of marketing, who is responsible for the overall operations, manufacturing and developing and implementing the sales and marketing strategies.
Photo of management team
Source: AlphaLab by Fifth Person.
The screenshots below set out the details of some board members and management team, mainly extracted from company filings (there are not much other publicly available information on them). A few notable points are:
there are seven board members, i.e. the four executive directors listed above and three independent non-executive directors – Mr. Cheung Yat Ming 張一鳴, Mr. Ding Baoshan 丁寶山, and Mr. Sai Chun Yu 佘振宇;
the three executive director gentlemen (Mr. Lu, Mr. Zhang and Mr. Wu) have been with the company since founding in 2003, are all textile veteran (even before the founding of the company) with 20+ years of industry experience (starting with either elastic webbing (Mr. Lu, chairman) or elastic fabric (Mr. Zhang, CEO)), and are still at a decent age of around 50 years old;
Zheng (current VP of marketing) joined the company a few years later in 2006 as a sales manager, and then vice president of marketing and also COO for a certain period, and before that she was a sourcing specialist with a stationery company (Parker Pen (Shanghai) Limited) in 2004-2006;
the CFO (and company secretary), Mr. Chan Yiu Sing (陳耀星) (39), is a relatively young guy (as compared to the other executives) and is responsible for ensuring and maintaining the standards of corporate governance of the company (note: capital allocation and other strategic financial decision makings are not mentioned in the company filings). He has 12 years of experience in au audit, investment, accounting and finance, and presumably no industry experience;
the vice-president of R&D, Mr. Shi Jiangzhi (石蒋志) (36), is responsible for leading the efforts to develop innovative technologies in support of the company’s strategic R&D plans. Although he is young, he has been in the textile industry for 17 years, since 2001. He has joined the company since founding, working in various departments and then supervisor and manager of various departments (including planning department), before being promoted to VP of R&D in April 2011. His academic studies (mainly certificate level) were in computer application and then textile engineering (Hunan College of Textile), and electrical maintenance (Labor Bureau in Xiangan City); and
the executive directors are also involved in and hold positions in various local/regional associations (mainly in Dongguan, where the company is based), as follows:
Mr. Lu: Since July 2017 and April 2017, Mr. Lu has been appointed as the president of Dongguan City MaChong Association of Enterprises with Foreign Investment (東莞市外商投資企業協會麻涌分會) and as an executive director of World Dongguan Entrepreneurs (世界莞商聯合會) respectively;
Mr. Zhang: Mr. Zhang has been a director of the Guangdong Textiles Association (廣東省紡織協會) since November 2009 and an individual life member of the Hong Kong General Chamber of Textiles Limited (香港紡織商會) since September 2013; and
Mr. Wu: Mr. Wu has been a member of the High-tech Enterprises Association in Dongguan City (東莞市高新技術企業協會) since July 2009 and a director of the Dongguan City Association of Enterprises with Foreign Investment (東莞市外商投資企業協會) since November 2013.
Details of board members and management team
Source: 2017 annual report and 2014 IPO prospectus.
Alignment of interest & shareholder friendliness
On ownership, the management owns a very large portion of the company of around 73%, with Mr. Lu (the chairman) owning 62% of the company. Thus, the management is aligned with the shareholders as they themselves are large shareholders.
Best Pacific’s management ownership
Source: Annual reports.
However, in such cases where the management has very large ownership (of above 50%), the minority shareholders have to be cautious as to whether the management are thinking of and taking care of the minorities well, or are taking advantage of them (due to their executive roles and large control of the company).
In my view, the management is fine in this aspect based on their past behaviour and actions (or at least no red flag stands out to me), and in terms of the use of cash, has been either using the free cash to pay down debt or distributing the excess free cash back to shareholders, in line with the stated dividend policy of minimum 20% payout ratio (and increasing the dividends per share from HKD 8.5 cents in 2014 to HKD 16.8 cents in 2016, albeit dropping to HKD 5.9 cents in 2017 due to the challenging situation that year).
Besides that, in terms of remuneration:
the management has been paying themselves reasonable amounts of salaries with large performance-based components. For example, in 2014 to 2017, Mr. Lu (the chairman) received total compensation of around HKD 4m to HKD 7m per year, which was 3% to 2.5% of profit after tax for the year, and the performance-based component was around 37% to 56%;
for the three gentlemen (i.e. excluding Ms. Zheng), the dividends that they received for the year were at most times greater than their remunerations for their executive roles, and especially so for Mr. Lu, where his dividends were 9x to 16x his executive remuneration. This, to me, is a very good point from the perspective of the minority shareholders, because this basically puts Mr. Lu on the same boat with the minority shareholders. If the company does not perform, even though he can still try to pay himself similar levels of executive remuneration, the reduction in the amount of dividends that the company can distribute to him sustainably in the long term would be much larger than what he gets from the executive remuneration;
in 2017 when the company were hit on gross and net profits, all of the four executive directors were not paid any performance related payments, which effectively reduced their remuneration by around HKD 1m-4m (or around 40% pay cut compared to the previous year for a few of them); and
Zheng received a very substantial sum of HKD 13m of performance related incentive payments, which was almost 7x her fixed salaries. However, I have not been able to identify what those payments relate to, why they were paid and whether they were reasonable, which may be a cause of concern (especially if this happens again in the future).
Best Pacific’s management’s remuneration
Source: Annual reports.
Overall, I feel that the management is aligned with shareholders, mainly due to their large stakes in the company, and have been paying themselves reasonable amount of compensation (and not taking advantage of the minorities).
Capital allocation
In my opinion, the management’s capital allocation behaviour has been decent thus far (albeit only a short operating history of more than four years since IPO), due to the following points:
the company has indicated and kept the same dividend policy over the years, i.e. minimum 20% payout, and has done so generally (except for 2014) – 25%, 14%, 31%, 34% and 32% in 2013 to 2017 respectively;
the company has been using its operating cash flows reasonably over the past five years – by first paying down its massive debt accumulated pre-IPO and building up some cash position at the same time in 2013 to 2015, and then gradually increasing its investments in assets (PPE or production facilities, and working capital) to grow the business to cater to increasing demand and opportunities in the market (especially sportswear) and taking up debt where necessary to a reasonable amount in 2016 and 2017; and
in November 2015, the company made an acquisition of 40% of Charming Elastic (and its subsidiary, Jiangxi Charming Elastic Fabric Wearing Company Limited) that was involved in the manufacturing of elastic webbing in China, and was then slightly loss-making (according to a Oriental Patron 2015 report), from Top Form (a listed underwear garment and a leading brassiere maker, and a top 10 clients of Best Pacific),to increase its production capacities to grow. The company paid HKD 9m-10m for 40% then, and then, in 2017 a further HKD 13m to increase its stakes to 51% upon Charming Elastic meeting the financial performance target.Best Pacific’s share of the post-acquisition profit of Charming Elastic was HKD 5m and HKD 4m in 2016 and 2017 respectively. This translated to an annual ROI of 54% based on the first tranch of investment (= HKD 5m / HKD 9m), and at least 21% based on the total of the two tranches of investment (= (HKD 5m + HKD 4m) / 2 / (HKD 9m + HKD 13m)). The ROI of more than 20% on this investment is, in my opinion, good, and provides some indications of good capital allocation skills of the management (at least in this one case).
One minor whine that I have is that the CFO appears to have less experience (both in terms of years, and in terms of industry experience) than the executive directors and therefore may not be contributing to the capital allocation activities of the company much (although I could be wrong). This probably leaves the executive directors to have to take on this very important task more heavily, although they might not have the relevant financial skills (at least based on their academics) to deal with them well.
7. Risks
Main risks
In my view, the main risks facing Best Pacific include:
its dependence on its customers’ sales performances, which are subject to changes in trends/fashion that are not easy to predict at times.In Best Pacific’s case, this risk is partly mitigated by its diverse customer base of >300 customers, and lower level of customer concentration of 36% (in terms of revenue) for top 5 customers (as compared to some other leading peers which can have up to 80% or more concentrated on their top 5 customers), which has come down from ~40% in 2014 and 2015 as it acquires more customers.However, its sales to its largest customer, i.e. Victoria’s Secret, still constituted a large portion of total revenue, at around 25% (12% lingerie and 12% sportswear as of 2016), where Victoria’s Secret sourced around half of its supplies (excluding lace materials, which it sourced from others) from Best Pacific. Thus, Best Pacific is subject to some extent to Victoria’s Secret’s sales performance, which has not been good in the past few years, with its same-store comparable sales declining, with it losing market share to others especially to players with more natural-oriented (instead of bombshell-oriented) type of bras (e.g. bralettes) like Aerie (by American Eagle Outfitters, which has been performing very well in the past few years), and with it discontinuing its swimmear product line. Victoria’s Secret’s overall sales growth has turned positive in June 2018 at 1%, although its same store comparable sales (for retail stores) growth are still in the negative 1%-2% region, but its online sales growth has been quite positive (albeit still a small segment).Hopefully, Victoria’s Secret’s sales would start to stabilise more (and recover), and Best Pacific would be able to secure more customers to reduce its exposure to Victoria’s Secret’s sales performance;
expansion execution risks, where Best Pacific used to operate only in China, but is now expanding to Vietnam and Sri Lanka, locations with different operating environments and where the management might have less operating experiences. Any delay or disruption in production would affect the revenue and profits of the company.For example, Pacific Textile, a competitor of Best Pacific, faced a special unforeseen circumstance for its Vietnam plant, where the operations were interrupted due to the gateway being blocked by villagers for around 9 months, from April 2017 until January 2018, which adversely affected its financial performance for that period.Meanwhile, Regina Miracle, an IDM and a major customer of Best Pacific which built its first Vietnam plant in March 2016 in VSIP (i.e. the same location as Best Pacific), took around two years of smooth operations for its Vietnam production line to start contributing profits. Going with the same timeline, it might take another year for Best Pacific’s Vietnam plant, which started official production in 2017Q3, to start turning in profits (although Best Pacific has higher margins than Regina Miracle, so it might be able to turn in profits earlier).This expansion execution risk is a risk that would affect Best Pacific continuously, even after it manages to run the Vietnam and Sri Lanka plants smoothly in the future. This is because for Best Pacific to grow (which is still the management’s intention right now, unlike Pacific Textile that just distributes out all free cash flows), it would have to continously expand its production facilities and capacities to be able to manufacture and sell more volumes;
foreign exchange movement risks, where Best Pacific mainly sells in USD and HKD, and incurs costs in RMB, so any appreciation of RMB would have some adverse effects on its profitability. To mitigate this risk, Best Pacific “entered into certain foreign-exchange contracts to pay U.S. dollars and receive RMB” (based on IPO prospectus) and “manages its foreign exchange risk by performing regular reviews and monitoring its foreign exchange exposure. Our finance department will monitor our foreign exchange risk on a continuous basis by analysing our domestic and overseas sales order on hand, expected domestic and overseas orders from customers and estimated foreign currency payment for our purchases. We intend to manage our foreign exchange risks by (i) managing our sales, purchases and expenses denominated in Hong Kong dollars and U.S. dollars through our Hong Kong subsidiaries and managing our sales, purchases and expenses denominated in RMB through our PRC subsidiaries; and (ii) holding cash and bank deposits denominated in RMB primarily by our PRC subsidiaries and cash and bank deposits denominated in Hong Kong and U.S. dollars primarily by our Company and Hong Kong subsidiaries” (based on 2014 report). With the expansion of international production layout in Vietnam and Sri Lanka, this risk should reduce; and
increasing challenges in the textile industry in general, where the customers (brands) are having greater demands in terms of (shorter) lead time (to cater to the fast fashion trend cycle, and for just-in-time production), lower costs for their raw materials, greater product innovations, etc. This risk should affect more adversely the players that are smaller and do not have any niche, and players that do not have much competitive advantages or moat, and in turn result in industry consolidation with the stronger players (which I think Best Pacific is) staying in the game or emerging stronger. Even then, Best Pacific would have to continuously innovate and produce good quality products to continue to get orders from the customers.
Other minor risks
There are also a few other risks which I deem more minor, as follows:
fluctuation (or increase) in raw material prices – In my opinion, this affects the upstream players more. Given its cost-plus pricing model, as long as Best Pacific can continue to produce quality and innovative products (through its R&D activities), Best Pacific should be able to pass on most (if not all) of the increase in raw material costs to the customers;
short operating track record as a public company post-IPO – Best Pacific has only operated for around four years as a public company since its IPO in May 2014, and running a public company well could be slightly different from running a private one well, for e.g. the company is now a larger company, more focused on growth and expansion, and has more financing options to consider;
interest rate risk – As the company stated in its 2017 report, “With our current reliance on debt financing, the Group expects the overall borrowing costs to increase in 2018. Our management will continue to closely monitor the interest rate exposure and will consider hedging strategies should the need arise”; and
greater volatility of lace selling price – According to a Daiwa 2014 report, “ASPs and order flow for lace tend to be more volatile than for elastic fabrics and webbing, as demand for lace is more dependent on trends in fashion and design.” This is seen in 2017, where Best Pacific’s lace revenue declined by 22%, due to the market demand for simpler and thinner lace, which commanded a lower unit selling price. However, lace is still a very small segment in terms of revenue (3% in 2017), so this is less of a concern now.
8. Valuation
My valuation
To value Best Pacific (or rather, to estimate a value that I am willing to pay for), I use a simple P/E and EV/NOPAT multiple approach, and consider three main scenarios – conservative, reasonable and optimistic.
I make the following assumptions for my inputs, for the conservative, reasonable and optimistic scenarios respectively:
PAT: HKD 300m (based on 2017 figure), HKD 400m (based on my estimate as explained earlier to normalise for costs associated with the start-up phase of Vietnam expansion in 2017), and HKD 450m (assuming further improvement in margins from improved operations efficiency and utilisation in Vietnam and improved operating leverage, and the HKD 450m is slightly lower than that achieved in 2016 of HKD 456m);
NOPAT: HKD 330m (based on 2017 figure), HKD 440m and HKD 490m, of which the latter two are scaled up using the ratios for PAT;
Expected growth: As explained earlier, ROE of 18% and reinvestment rate of 70%, resulting in expected growth of 13%;
Multiple: 10x (equivalent to 10% earnings yield and close to 10% FCF yield – Best Pacific’s free cash flow conversion is good, although it may get pressure from working capital side), 13x (i.e. same as expected growth level, going by the logic of Peter Lynch’s PEG, which I firmly believe in) and 16x (if ROE or reinvestment is higher than what I assumed for my main case);
Net debt (where applicable): HKD 1.0b (based on 2017 figure) for all scenarios; and
Shares outstanding: 1.0 bilion shares (based on end 2017 figure) for all scenarios.
My valuation of Best Pacific
Source: My own analysis and annual reports.
Based on the above, I consider Best Pacific to be worth around HKD 4.50 to HKD 5.00 (based on my reasonable scenarios), with upside to HKD 6.60 to HKD 7.00 if things turn out better. These imply a margin of safety of at least 50% based on the share price of HKD 2.34 as at 14 July 2018.
In the conservative scenarios (which do not incorporate any recovery in financial performance from the start-up phase of Vietnam expansion in 2017, which I consider highly unlikely), Best Pacific is still worth around HKD 2.20 to HKD 2.90, translating to a maximum loss of 5% based on the current price.
This situation can be summed up nicely as a “Heads I win, tails I don’t lose up” type of situation, one favoured by Mohnish Pabrai (a Dhando investor with a concentrated portfolio and impressive track record).
On a separate note, my assumed P/E level is in line with Best Pacific’s historical levels, and lower than its peers’ historical levels (although the peers are larger and have longer histories as public companies).
Best Pacific’s historical P/E levels
Source: Maybank Jul 2017 report.
Source: Maybank Jul 2017 report.
Best Pacific’s peers’ historical P/E levels
Source: Maybank Oct 2016 report.
Floor value
There is also an interesting phenomenon which I have observed for Best Pacific. In my opinion, the market sees Best Pacific as a growth or dividend stock, more so the former, and in such cases the market tends to focus on earnings and forget about assets.
The market capitalisation of Best Pacific has dropped to HKD 2,426m (as at 14 July 2018), which is close to its net book value of HKD 2,301m (constituting HKD 4,215m of assets and HKD 1,914m of liabilities). The HKD 4,215m of assets are made up of:
HKD 2,277m of PPE (of which around HKD 1.0b was new additions in 2017);
HKD 694m of inventories;
HKD 648m of trade receivables;
HKD 243m of cash and cash equivalents; and
HKD 352m of other assets (HKD 105m of deposits, HKD 103m of prepaid lease payments, HKD 81m of other receivables, deposits and prepayments, and others).
In my opinion, it’s hard to see how a leading textile player (world largest lingerie material maker to top brands, and growing sportswear material maker that has been securing new renowned brands for the past few years), which has spent around HKD 267m on R&D activities (which are not capitalised) in the past five years and produced innovations used by top brands, with more than 15 years of operating history and more than 60 patents (not recognised on is balance sheet), could be worth only its net book value (comprising decent/good quality assets with ROA of above 10%).
Thus, I consider Best Pacific’s net book value of HKD 2,301m or HKD 2.24 per share to form its absolute floor value, which is slightly lower than the current price of HKD 2.34.
As Mike Zapata, a former US Navy SEAL (development group, or more commonly known as the SEAL team 6) member turned fund manager said, “buy on balance sheet, sell on earnings” – in my case, it’s “buy on balance sheet, extract value (as a business owner) from earnings”.
What has the market gotten wrong?
One question worth pondering about (for every investment) is that why I am right, or why the market is wrong. No one knows what the market is pricing in, but my guess is that the market is over-concerned with the expansion activities in Vietnam (and Sri Lanka soon) and the resulting decline in profits in 2017, and potentially any trade wars and economic uncertainties with hot or big money flowing out of Asia back to the U.S. (or elsewhere).
In my view, the market in general tends to not distinguish between uncertainty and risk (which to me is permanent loss of capital), equate the both as same, and discount for them in the security price. This sometimes can present good opportunities for investors who are willing to stomach the uncertainties, especially if those uncertainties do not really pose the same level of risks.
In Best Pacific’s case, I do agree that there are uncertainties, and a certain lower level of risks, involved with the expansions in Vietnam, in the sense that it is not easy to estimate reliably what level of orders, utilisation and improved operating performances can the Vietnam operations achieve, and when. However, I consider all such uncertainties (which do not translate fully into risks) have been priced in, and when all bad things are priced in, the only situation that can unfold is the future is either the same, or positive developments.
9. Concluding thoughts
Overall, I see myself as buying into a good quality business (high ROE and ROIC) with non-excessive leverage (43% net-debt-to-equity now, which should come down in the future) that is swimming with the tide (moderate tailwind in lingerie, and strong tailwind in sportswear) and run by good decent-aged founder-owner-operators who has built this company for more than 15 years (and to the world largest lingerie materials maker (with revenue of HKD 1.7b in 2013) in less than 10 years since founding in 2003, which is an impressive feat to me) with large stakes at play (73% ownership, with dividend payments exceeding the executive remuneration (around 10x or more for Mr. Lu) with substantial performance‑based components) and are still actively thinking about and growing the company for the long term (by going IPO in 2014 and strategically expanding into Vietnam (2017) and Sri Lanka (this and next year), which are long-term initiatives and not short-term goals.
In terms of where I see the business in 5 to 10 years, I see Best Pacific as doubling its overall business in 5-6 years (to revenue of about HKD 6b), with its international production layout maturing and situated close to its customers (lead time is very important) and its R&D team churning out new innovations and sales/marketing team securing new customers for growth and reduction of reliance on Victoria’s Secret, and its sportswear business overtaking its lingerie business (29% vs 71% now) in line with the management’s plans.
In terms of what moves the needles (and hence to monitor), I consider two main things for the long term – first, the ability of Best Pacific to continue to secure more orders from existing and new customers, especially from sportswear, without sacrificing its gross margins; and second, the willingness of the company to continue investing in R&D and its ability to produce new innovations/designs/patents – and one main thing for the short term, i.e. the smooth operations of the Vietnam plant and improvement of its efficiency to levels similar to the China plants.
Note: This is not a recommendation to buy or sell. As with all (value) investments, it’s of utmost importance to do your own due diligence. And as Peter Lynch puts it, “know what you own, and know why you own it”.
Disclosure: The author has long position in Best Pacific as at the time of writing.
Riverstone 2017 AGM at Raffles City Convention Center
Recently, I attended Riverstone’s 2017 AGM on 23 April 2018 at Raffles City Convention Center. I have been a shareholder of the company since September 2016 but this is my first time attending its AGM (finally got to meet the good management in person). It’s held in a relatively small room, with about 60-70 shareholders attending I think.
Riverstone is one of the good companies in my portfolio that I feel very comfortable about holding long-term (and accumulating if the prices are fair), due to various reasons – high ROE, very conservative capital structure, good industry tailwind, good management with high stakes in the company, reasonably solid moat, well paved expansion plans for the next few years, etc.
Aloysius from the Little Snowball did a very good job covering the company, so I would recommend reading it here (although I have slightly more conservative assumptions than his), especially if you are not familiar with this company.
Before I attended the AGM, I have already intended to hold it for at least another two-three years, unless the fundamentals, the industry dynamics or operating environment changes. After the AGM, I felt even more comfortable with my shareholdings in it, as I feel that the management is honest and down-to-earth and will be there working diligently and smartly to protect the business and our money in it (I was a little bit surprised at how soft spoken and humble Mr Wong Teek Son, the executive chairman and CEO, is, which is quite different from what I expected).
Here are 8 things I took away from the AGM!
1. Riverstone has strong moats in certain cleanroom gloves (especially Class 100)
Cleanroom segment has performed well and better than healthcare last year, and will continue to be the focus for the next few years, given the higher margins and strong demand. Overall market demand for cleanroom gloves is expected to grow at 10% per year, but as the market continue to switch from natural rubber to nitrile rubber gloves (which Riverstone is in), the expected market growth would be higher than 10%. Riverstone’s plan is to grow cleanroom volume by 20% per year steadily, which means taking some market share from both natural and nitrile rubber players. Although the sales volume side should not face much pressure, Mr Wong expects there would be some pressure on both pricing squeeze (2%-3% per year) and costs.
According to management, Riverstone among the few strongest players in cleanroom, with the biggest competitor being Ansell and Kimberly Clark (but one of them focus more on the U.S. and the other on Europe, and less on SE Asia). Within cleanroom, there are many sub-categories, in terms of material (latex, nitrile, PVC coated) and class. Riverstone is especially strong, or probably the best, in Class 100 gloves, with about 50% market share worldwide in terms of volume. These Class 100 cleanroom gloves made up about 20% of total revenue last year. According to Mr Wong, within Class 100, Riverstone has the best technology in the world, where its gloves emit only a certain low amount of electrostatic particles (something like that), and the next best competitor is still very far behind in technology in terms of that measurement. In terms of competition in Malaysia, there are very limited players in Malaysia in cleanroom. Besides that, a barrier of entry for new competitors is that the process to become a cleanroom vendor is longer than healthcare gloves, as the criteria is much stricter.
Riverstone’s cleanroom gloves are also highly customised. We can’t really put a % to how much of its gloves are actually customised for certain customers, and how much % are non-customised standard gloves/ solutions. This is because almost the entire solution/process/product is sort of customised, where Riverstone’s team engages with and work closely with the customers’ engineers in their production sites, for long periods, figuring out the specifications/ solutions that best fit the customers’ situation/demands. Some of their customers have been with them for decades, and they are always constantly working together to continue customising the best solution. Every customer is different, for e.g. each requires gloves that can withstand certain chemicals differently, and therefore it is not a simple standard process. These are the reasons why its customers are very sticky, according to Mr Wong. Furthermore, Riverstone deals directly with most of these customers (instead of going through distributors), which is time and energy intensive, but resulting in a very close relationship with the customers, which Mr Wong sees is one of the competitive advantages Riverstone has over its competitors in the cleanroom segment.
Overall, Mr Wong thinks that the key issue that decides whether Riverstone can perform well in cleanroom in the long run is whether it can constantly catch up in terms of technology, and not capacity/demand issues, as technology is really important in this field.
A side point on cleanroom expansion plan is that Riverstone has set up new service centers in Shenzhen and will set up centers too in Vietnam soon.
2. Healthcare overall demand is still strong
Overall demand for healthcare gloves is now 270 billion units and is expected to be 8% per annum (i.e. about 20 billion units per year). Riverstone is expanding 1.0-1.5 billion units every year, so it’s only a small portion of the total market increase.
According to Mr Wong, it is not easy to develop good and cheap healthcare gloves. The management running the company are very important, and training to personnel is very important too. Given that Riverstone has executed well and is now well recognised by the customers, Mr Wong is confident that this business segment will be consistent, as long as he and the team manage it well.
In terms of distribution strategy, Riverstone relies on distributors for big orders for large companies, which comprise a large portion of its sales. At the same time, Riverstone also specifically allocate some of its sales to small customers, in which it deals with them directly to establish a direct relationship (like its cleanroom segment) and performs some customisation solutions to build the business together with the customers. In short, Riverstone is trying to use its advantage of being a relatively smaller company and craft out some niche and competitive advantage here, instead of just mainly competing on costs and quality.
On issue of potential over-supply and excess capacities in the market, Mr Wong said that he is not concerned. He said that what you hear in the market is only companies/people telling you how much new capacities are coming in, but what you don’t hear is that how much of the existing capacities are old capacities that have to be retired or not being used.
On the recent problems faced by Chinese healthcare glove players due to pollution issues, the extra demand provided to non-Chinese players were taken up by Riverstone competitors, which is why we see Top Glove, etc doing very well in the last quarter. However, given that Riverstone has always been operating at almost full capacity (~90%), it does not have excess capacity to benefit from this situation.
And on R&D, the 20-strong R&D team used to be all doing R&D on cleanroom gloves, but now some of them are working on healthcare gloves to work on innovative products and some upgrading of existing products.
3. Continued efforts in automation will help to drive operating costs down
Mr Wong shared that although they have been implementing automation in the production processes for a few years, there are still much more room for automation. This is because the technology is always changing, and there are always new and better machines/technology that they can adopt. For e.g. two main areas with automation opportunities are stripping and packing, where the expected financial benefits of those automation are to drive the unit costs of that activity (per glove) down by almost 50%.
4. The current expansion plans will last until 2019
The current expansion plans entail building dipping lines (which are interchangeable between cleanroom and healthcare) of 1-1.2b units per year. The expansion plans are until 2019 only, because after that, the company will run out of land and has to find new land.
5. China sales are still doing well
The company has been getting more sales from China, but are not reflected as such in the annual report. This is because when the China orders become big, they would ship the orders from Malaysia instead of from China for various reasons (e.g. tax). Thus, they would be captured under Malaysia’s sales.
6. Mr Wong thinks that the greatest risks/concerns are not on the demand/revenue side, but on the cost side
Mr Wong mentioned that the next few years should be stable growing business, but the key risks (including for the long-term) would not be on the demand/revenue side, but on the cost side. In particular, two points, i.e.:
the supply of latex raw material, where the suppliers (like companies XX and XX – I forgot the name, but I mentioned Synthomer which Mr Wong acknowledged too) may not be able to supply sufficient volume (which will also result in increasing prices); and
the supply of resources, in particular water (and electric), as the gloves production processes consume massive amounts of water, and any shortage/disruption of water supply can be quite detrimental to the operations.
7. Other points
The recent take-up of borrowing is for Ecomedical Gloves for expansion into Vietnam (which is easier in terms of cash management across different geographies).
Receivable days for cleanroom are generally longer, at around 90 days, versus 0-60 days for healthcare.
Lim Sing Poew, who joined Riverstone as Group general manager in 2017, is actually the company’s ex-CFO last time. He went to work for a competitor Top Glove for 1.5 years, but came back in the end. (Note: I personally think that this shows something).
The company hedges 50% of its sales revenue every month (by selling forwards), and won’t change this hedging strategy because it’s hard to predict the changes. It prefers to focus on the business side, instead of the FX side.
The company’s remuneration is highly performance based, both for management and also for all employees to some extent. The staff costs in FY2017 increased by 20%, from RM80m to RM97m, due partly to increase in base salary (which happens every year) and partly to higher incentives for the year (all the employees, including general workers, got a 1-week incentive as the company achieved 10% growth in terms of profit over the previous year). Besides that, the management’s remuneration has a large portion based on performance too, where there is a minimum hurdle in terms of net profit to cross to start getting the profit sharing component, which increases as it crosses higher tier hurdles.
8. Last but not least, Mr Wong will still be here to run the business for the foreseeable future
Mr Wong thinks that the overall outlook for the company is still looking good. When asked whether he would sell out if approached by interested parties (e.g. the bigger glove companies which can benefit from its strong cleanroom segment), his answer for now is no. He said that his health conditions are still okay (although it’s very energy-intensive to run a glove company, due to the high level of focus needed – a disruption or an issue in operations for a few hours can lose a lot of production volumes), he is not in need of those finances too, and he is still passionate about the business, and therefore he wants to continue to run it as long as health conditions permit.
With Mr Wong Teek Son, Executive Chairman and CEO, who doesn’t pay himself any Director’s fees.
I personally am very reassured by this, by his passion/energy for the company (while adopting a conservative approach to grow the business – which protects the downside), which makes me feel comfortable handing my money to these diligent, honest and down-to-earth management for them to take care of it and compound it well (together with the growth of the business).
The Manual of Ideas (2013), by John Mihaljevic, is quite a good and different read. It is different because it covers a wide diversity of value ideas (nine categories of value ideas, as follows), and it focuses on a few key points within each value idea, i.e. the approach, uses and misuses, screening methods, methods beyond screening and the right questions to ask:
Graham-style deep value
Greeblatt-style magic formula
Small-cap value
Sum-of-the-parts or hidden value
Superinvestor favourites
Jockey stocks
Special situations
Equity stubs
International value investments
Personally, reading this cross diversity of value ideas/approaches allows me to examine the core value investing principles (ultimately all of them are value investing to a large extent) and ideas from various different perspectives. Even though I might focus on a few of the categories that suit my style/preference, I believe the ideas and knowledge from the other categories would be helpful at times and improve my cross-disciplinary and lateral thinking. As Charlie Munger always likes to say, ‘To a man with a hammer, everything looks like a nail”, and I will prefer not to be one such man.
This book also introduces me to a lot other investors whom I haven’t heard of and makes me learn more about some of the investors whom I don’t know well enough before this.
The key points that I got from each chapter are listed below.
Chapter 1 – A Highly Personal Endeavour
If I directed the allocation of the world’s capital, I would not be able to rely on the market to bail me out of bad decisions. The greater fool theory of someone buying my shares at a higher price breaks down if the buck stops with me. Successful long-term investors believe their return will come from the investee company’s return on equity rather than from sales of stock.
Thinking like a capital allocator goes hand in hand with thinking like an owner. Investors who view themselves as owners rather than traders look to the business rather than the market for their return on investment. They do not expect others to bail them out of bad decisions. (Note: Imagine myself as the CEO of Berkshire Hathaway, e.g. Warren Buffett, monitoring my (private) businesses’ operating earnings over time, and allocating more capital to the better ones, and in the end look to earn returns from the growth in those companies, not from the change in valuation/market sentiment.)
The old own-a-stock industry could hardly afford to take for granted effective corporate governance in the interest of shareholders; the new rent-a-stock industry has little reason to care.
Losses have a perverse impact on long-term capital appreciation, as a greater percentage gain is required to get us back to even. For example, a 20 percent drop in book value requires a 25 percent subsequent increase to offset the decline. (Note: This applies not just to my own investments, but also to the investments/ decisions made by the companies I am looking at or own too.)
Chapter 2 – Deep Value: Ben Graham-Style Bargains
“The problem is to distinguish between being contrary to a misguided consensus and merely being stubborn” – Robert Arnott and Robert Lovell Jr.
Finally, they came with considerably less opportunity to meet someone cool of the opposite sex while browsing, unless one was looking for a date who wouldn’t mind being taken to a meal at McDonald’s. You see, it took a certain type of person to enjoy bargain bin shopping – and it is no different with Graham-style equity investing.
Several years ago, Buffett was reported to have invested some of his personal portfolio into South Korean net nets – companies trading for less than their current assets minus total liabilities. The investment approach of Zeke Ashton, managing partner of Centaur Capital Partners, has evolved similarly. “We very much prefer our ideas to take the form of high quality businesses with excellent management that can grow value over the longer term, but we will buy mediocre assets if the price is right.”
Ben Graham, Walter Schloss, John Neff and Marty Whitman are just a few names that came to mind.
A holy grail of value investing might be uncovering opportunities that both provide asset protection on the balance sheet and include businesses with high returns on capital.
The truism that over the long term an investor in a business will earn a return closely matching the return on capital of the business is only partly true. If the business dividends out all free cash flow, a long-term shareholder will earn a return equal to the free cash flow yield implied in the original purchase price… As the payout ratio declines, the economics of the business becomes increasingly important.
States Nick Kirrage, fund manager of Specialist UK Equities at Schroders: “Staffing business… have big fixed overheads and quite volatile top lines, and profits can be quite volatile. Typically, the staffing industry understands this, and they therefore run with balance sheets that are either heavily net cash or very lowly geared. But the market becomes very focused on short-term profits, so once per cycle, the share prices collapse very, very strongly, and people just assume that profits either won’t recover or it will take too long for them to recover – and they can’t really be bothered to wait. For people who are willing to wait for three to five years, that’s wonderful, because you’re not taking balance sheet risk. Therefore, the chance of you permanently losing money is very low. The chance of you making quite a lot of money, because the operating leverage works both ways, is very high“.
Scott Barbee, portfolio manager of Aegies Value Fund, says “we generally like to buy companies trading at significant discount to their asset values and at mid to low single-digit multiples of normalised earnings two to three years out”.
Comfort can be expensive in investing. Put differently, acceptance of discomfort can be rewarding, as equities that cause their owners discomfort frequently trade at exceptionally low valuations. (Note: This applies to all investing – Take advantage of it!)
Investors typically do worst when they enter situations in which they lack staying power, whether due to financial or other reasons.
Perhaps this is why many investors either adopt an approach and stick with it or evolve from one approach to the other. Few investors apply both approaches (Buffett-style and Graham-style) successfully at the same time in the same investment vehicle.
When we attempt to extract value from poor businesses with valuable assets, impatience becomes a virtue. We are not referring to impatience with the stock price – quite to the contrary… Instead, we refer to impatience with regard to the course of the business itself.
We find it difficult to argue against Marc’s conclusions, and denial is never a recipe for success, whether in investing or in life. If we accept that creative destruction will continue at least at the pace experienced throughout recent history, then it becomes obvious that businesses trading at deep value prices are likely to be among those that are creatively destroyed… It seems unwise to allocate a large portion of investable capital to any one deep value opportunity, even if the latter promises a large expected return.
With smart investors eager to invest in Graham-style bargains, any remaining net nets are likely to possess disqualifying risks (note: this, to me, is second level thinking). As a result, investors may want to keep track of the historical proportion of net nets in various markets around the world. When the proportion exceeds the average, conditions may be ripe for successful deep value investing.
According to Whitman, some long-term assets may be more readily marketable than certain short-term assets. For example, a Class A office building in Manhattan may be easier to sell without impairment than the inventory of a failing retailer.
Value creation via buybacks – Share repurchases tend to be particularly accretive in the case of companies generating cash from operations while trading below tangible book value. If such companies apply free cash flow toward buying back stock, they accrete tangible book value per share, widening the gap between the market price and accounting net worth… When the stock price of Sears Holdings declined below book value a couple of years ago, Bruce Berkowitz argued that the game would be over for short sellers of Sears stock if Eddie Lampert simply kept buying back stock. Berkowitz appeared to refer to the per-share accretion dynamic described here.
We know that the mood of insiders generally swings in close concert with that of other market participants – this is why we see more merger and acquisition activity when prices are high rather than low. When insiders act against the psychological tendency to simply hunker down and not throw good money after bad into a stock that has underperformed, they express a view that the market has overreacted on the downside. Most insiders, by virtue of being businesspeople rather than investors, may weigh operating performance more heavily than the equity valuation in their stock purchase decisions. As a result, it may be rare for insiders to buy stock unless they believe the fundamentals of the business are at least okay.
When a business with high working capital requirements hits a speed bump or enters a permanent period of stagnation, working capital needs decline, freeing up cash. In addition, lower capital expenditure (capex) requirements typically mean that the depreciation recorded on existing plant and equipment exceeds maintenance capex. This dynamic causes slow-growth businesses to report free cash flow well in excess of net income. If the market is overly focused on sales declines or the income statement, an opportunity may exist to acquire a business at a high free cash flow yield.
Jeroen Bos stresses the importance of a strong top line, as sales restoration might be more difficult to achieve than margin improvement: “I like to see a company that has huge volumes but is not making money… than a company where sales are just completely evaporated, and it has to earn those back.”
In his context, it makes sense to start with the quotation the market is putting on a company, although we might normally prefer to appraise an equity security before learning of the market’s appraisal. When we confront an equity that is undeniably cheap (though perhaps not undervalued), we gain insight by extracting the key question embedded in the market price – and answering that question correctly.
Such a negative development is not farfetched, as businesses with low capital intensity tends to be most susceptible to competitive threats. When something other than capital employed drives the profits of a business, that something can change quite easily unless the business has a sustainable moat. Businesses with low capital intensity may be more likely to exhibit winner-take-all dynamics, as capital is not a barrier to scale. Consider how quickly Apple crushed well-established companies Nokia, Research in Motion, and even Sony. This was only possible as Apple did not need to scale capital employed alongside market share. Investors who considered investing in beaten-down equity of Nokia too early because the Finnish company seemed to have a capital-light business in addition to large net cash holdings might have been surprised by the degree to which the profitability of the capital-light business would be affected by competition.
We like to think about value in these types of situations as follows: If the primary valuation ratio remains constant, will the stock price increase or decrease over time? … Mohnish Pabrai states in a similar context: “I value [consistency of earnings] more than the absolute cheapest business, because then we know there is some sustainability to the cheap business getting even cheaper, and eventually gravity takes over”. Robert Robotti, president of Robotti & Company, also looks for deep value situations in which intrinsic value grows over time. (Note: This applies to both deep value investing and moat investing too (a form of margin of safety)!)
According to Toby Carlisle, “The assets of a company are typically worth more as part of a going concern than in liquidation, so liquidation value is generally a worst-case outcome. In my experience, most ‘net net’ companies have been turned around, rather than liquidated”.
Economists Eugene Fama and Kenneth French have studied the relationship between stock performance and book-to-market ratios. They have consistently found that equities with high book-to-market ratios outperform those with low ratios.
When we invest in an asset-rich but low-return business, time may be working against us. As long as management can hold on to the assets and keep reinvesting at low returns, shareholders may earn unimpressive returns despite a bargain purchase price. As a result, catalysts become a relevant consideration.
Chapter 3 – Sum-of-the-parts Value (Investing in companies with excess or hidden assets)
Investors usually analyse a company as a monolithic whole, appraising value based on overall book value, earnings or cash flow. However, many companies can be appraised most accurately by analysing each of their distinct businesses or assets separately and then adding up those components of value to arrive at an estimate of overall enterprise or equity value.
Sometimes investors, in their zeal to create a sum-of-the-parts opportunity, slice a company into too many parts, creating an attractive investment thesis in theory but not in reality… However, when the services business is built largely around hardware, the former could evaporate if the hardware business becomes obsolete. In such a scenario, a sum-of-the-parts valuation of interconnected hardware, software, and services units might trigger too optimistic an appraisal of value. (Note: Look out for the inter-dependency and interaction of the different business segments, especially when they have different margins)
Stephen Roseman, a portfolio manager of Thesis Fund Management, has made catalysts a key component of his investment approach. “One of the non-negotiable requirements I have with respect to committing capital – on the long side – is a tangible catalyst I can point to within the ensuing six to twelve months. Capital has a cost, and this discipline helps to improve returns in two distinct ways: it helps to avoid value traps, a common foible of value investing; and it helps to improve IRR as capital is deployed closer to events that might help realise value”. (Note: I can apply this catalyst thinking to my own investing style (wonderful companies) too, only if appropriate)
In the case of a sum-of-the-parts situation like Berkshire Hathaway, the whole may be greater than the sum of the parts due to Warren Buffett’s ability to create value through capital allocation. In the case of most other conglomerates, a discount to the sum of the parts may be appropriate.
Intersegment sales frequently indicate the degree to which the various segments depend on each other. (Note: Check the amount of intersegment sales)
The value of sum-of-the-parts valuation exercise grows when the various business segments demand distinct approaches to valuation… Promising ideas include companies with businesses in more than one industry, businesses with vastly different returns on capital, and companies with unexpectedly large businesses in fast-growing geographies.
Finally, in the case of an apparently undervalued equity, the perception that some assets are hidden from the view of most investors may explain why the company is undervalued. Seth Klarman has argued that we strengthen an investment case when we understand why the market may have missed, misjudged, or even created an investment opportunity. For example, if we uncover an apparently undervalued company whose stock price has plummeted, the investment thesis will be strengthened by knowledge that a large institutional shareholder was forced to sell shares due to a need to satisfy redemptions of capital by the shareholder’s clients.
We have also identified smart investors who appear focused on unusual situations, including equities with overlooked sources of value. We list 10 such investors – Bill Ackman (Pershing Square Capital Management), David Einhorn (Greenlight Capital), Carl Icahn (Icahn Associates), Daniel Loeb (Third Point), Mick McGuire (Marcato Capital Management), Lloyd I. Miller III (private investor), John Paulson (Paulson & Co), Michael Price (MFP Investors), Wilbur Ross (WL Ross & Co), and Marty Whitman and Amit Wadhwaney (Third Avenue Management).
Investors may indeed become patsies by failing to realise how many other smart investors have bought into the same story of hidden value. If the perceived discount to fair value does not exist or is later eliminated due to new developments, the outcome might be made more painful because many like-minded investors head for the exits at the same time.
By falsely concluding that the market is ignoring the noncore assets, we may overpay for the core business and end up with a value trap… It rarely pays to invest in perceived hidden value unless we like the core business as well.
It matters tremendously whether the offer is “buy one, get one free,” or “buy 10, get one free”. As shoppers, we recognise the former as a more compelling offer. As investors, we often overlook this important distinction.
Chapter 4 – Greenblatt’s Magic Search for Good and Cheap Stocks
Joel Greenblatt’s track record of 50 percent annualised returns during the 10 years he ran a hedge fund, Gotham Partners, was virtually unmatched in the industry.
The longer the holding period, the smaller the role of the exit multiple in determining the investor’s annualised return.
To normalise for different tax rates, we use operating income as the numerator of the equation. To normalise for the effects of financial leverage, we use capital employed as the denominator. Greenblatt defines capital employed as current assets excluding cash, minus current liabilities excluding debt, plus net fixed assets, typically consisting of the property, plant and equipment line item on the balance sheet.
A few years ago, Joel Greenblatt and Blake Darcy launched Formula Investing…
While the market is pretty good at valuing high-return businesses that have reached a steady-state phase of limited reinvestment opportunities, Mr. Market makes two mistakes with some consistency: It overvalues high-return businesses whose returns on capital derive from explosive but ultimately transitory trends or fads… On the flip side, the market may undervalue unhyped quality businesses with sustainable high-return reinvestment opportunities.
Similarly, capital-intensive businesses near the top of the cycle have unsustainably high returns on capital employed.
As a result, a crucial determination when evaluating magic formula selections is whether they exhibit above-average returns on capital for transitory reasons or for reasons they have some permanence. Warren Buffett calls this moat; others may know it as sustainable competitive advantage. (Note: Be careful not to be just a data analyst – Remember to think about qualitative and think forward-looking (and the business model)!)
Adds Josh Tarasoff, general partner of Greenlea Lane Capital Partners: “One of the most powerful ideas I have ever encountered is the one-decision stock: a company you can simply hold for a decade or two and receive an outstanding outcome”.
Durability of competitive advantage relates quite closely to a firm’s ability to raise prices in excess of inflation… According to Tarasoff, only real pricing power, that is, the ability to raise prices in excess of inflation, should be regarded as special… When and to what degree a company chooses to exercise its pricing power depends on a number of factors, but the key consideration for investors is whether a firm could raise prices without materially impacting unit sales.
High returns on existing capital – the capital already employed in a business – are almost meaningless without an ability to invest new capital at above-average returns. Returns on existing capital, whether high or low, are already reflected in a company’s operating income. In a static scenario, the driver of return to equity investors is the earnings yield – or free cash flow yield, to be more precise.
Estimating the extent of the reinvestment opportunity available to a business is no small feat. Josh Tarasoff sheds light on this issue: “For a significant reinvestment opportunity to exist, there must be the potential for long-term unit growth. So, a large addressable market relative to current business is desirable…”
From here on, the points will become much less, as I am becoming lazy… LOL
Chapter 5 – Jockey Stocks (Making money alongside great managers)
Chief executives can distinguish themselves in two major ways: business value creation and smart capital allocation.
Mr Market has a tendency to deify certain executives, sending their companies’ stock prices into the stratosphere and condemning new purchases of stock to likely underperformance. As investors, our goal should be to identify chief executives who are themselves underappreciated.
Times change; human nature apparently doesn’t.
A chief executive should own stock (not options) with a market value equal to at least several years of annual cash compensation. Anything less may make the CEO more interested in maximising the pay package than per-share value.
Tom Gayner points to an often overlooked check – leverage. “One of the great investors I’ve tired to learn from is Shelby Davis [founder of Davis Selected Advisers]. Shelby said that you almost never come across frauds at companies with little or no debt… If a bad person is going to try and steal some money, they will logically want to steal as much as possible.
Daniel Gladis points to incentives as a key reason for investing in family-controlled businesses: “If a family has half or three-quarters of its assets invested in this particular business, they’re probably going to take care of it better than a management for hire that comes and goes in three or four years”.
Many business school graduates aspire to be great business leaders. Few aspire to be great capital allocators.
Charlie Munger’s advise to invert serves us well when analysing managers – not in identifying the greatest jockeys but rather in eliminating the bad actors, even when those individuals are esteemed by the business establishment. An acid test is compensation.
Between the extremes of excellent and poor capital allocators is a world of mediocrity, in which managements often view reinvestment of capital as the default option, giving little consideration to the alternatives.
Chapter 6 – Follow the Leaders (Finding opportunity in superinvestor portfolios)
In a review of Youngme Moon’s book Different, Guy Spier writes, “… In saying “no” to the vast majority of people, these businesses ensure that the only people who become customers are those who will value and appreciate the specific configuration the company is set up to provide.” (Note: Ask, is the company in my portfolio saying no to anything? And am I, as a capital allocator, saying no to anything?)
Most superinvestors view themselves as employers of management, and they are generally not shy about voicing their views on how existing equity value can be unlocked or new value created.
Superinvestors are neither heroes nor infallible. The specific idea we might be copying could turn out to be one investment that becomes a complete write-off.
The first step in setting up a superinvestor tracking system is deciding which investors to track. Several factors figure into this decision, including the concentration of an investor’s portfolio, average portfolio turnover, propensity to employ short selling, and the congruence between one’s own investment approach and that of a superinvestor.
Turnover is an important consideration because as outside observers we receive only delayed notice of other investors’ buy-and-sell activity.
Context is important when assessing the purchase and sale activity of superinvestors.
This chapter also includes a long list of superinvestors in the following categories – Large-cap value, Mid-cap value, Small-cap value, Graham-style deep value, Buffett/Greenblatt-style quality value, Highly concentrated portfolios, Industry specialists, and a few hard-to-follow superinvestors.
Chapter 7 – Small Stocks, Big Returns? (The opportunity in underfollowed small- and micro-caps)
Several key developments have created opportunities for small-stock investors, including an increase in the size of institutional portfolios, an escalation of compensation expectations, exclusion of small stocks from major market indices, and scant research coverage by sell-side firms.
Even if small caps as a group stop outperforming large caps, the differential between top and bottom performers should continue to be greater in the case of smaller stocks, providing opportunities for research-driven investors.
One well-known drawback of small-stock investing is the, at times, severely constrained trading liquidity of smaller companies. Wider bid-ask spreads, greater market impact, and perhaps greater trading commissions conspire to make entering and exiting the equity of small companies a costly affair.
Chapter 8 – Special Situations (Uncovering opportunity in event-driven investments)
In markets that exhibit informational inefficiency (Note: Look out for e.g. different segments, with different growth rates, and different profitability (masked), which are not captured by standard financial databases), rewards may accrue to those who make the effort to obtain timely, accurate and relevant information.
Investing rules, as distinct from laws, need to be broken occasionally in the pursuit of investment excellence. In this context, rules include the financial formulas (Note: e.g. calculation of EV, when other items like prepaid liabilities may need to be considered and adjusted for) we have memorised along the way.
Special situations are one of the few investment areas in which it makes sense to pay at least as much attention to the time component of annualised return as to the absolute return expected in a particular situation.
In the absence of identifiable drivers of inefficiency, the probability may be higher that our appraisal of value contains an oversight or flaw. If we can identify a non-fundamental factor that explains the low valuation, we gain confidence in an estimate of value that differs from the market price.
We need to be careful not to overrreach when our judgment turns out to have been correct. The payoffs in equity stubs may exert an intoxicating effect on the successful investor.
The tendency of investors to think about the likely outcome rather than the range of possible outcomes represents a key stumbling block to success in leveraged equities.
Our experience suggests that industry-wide sell-offs represent better hunting grounds for potential opportunities than do company-specific crises. A single company may stumble in a way that makes recovery of value impossible, but entire industries disappear rarely.
The market sometimes ignores the nonrecourse nature of a company’s debt, perceiving the equity as riskier than it actually is. This creates opportunity for research-driven investors.
Chapter 10 – International Value Investments (Searching for value beyond home country borders)
“See the investment world as an ocean and buy where you get the most value for your money” – Sir John Templeton (Note: Fish where the fish are!)
In the interviews we conducted with leading investment managers around the globe, most of them expressed a view that the commonalities of international markets outweigh the differences.
Numerous studies confirm that adding international equities to a portfolio improves the risk-reward profile, either by boosting expected returns for a given level of volatility or by lowering the volatility for a given level of return.
Many investors appear to make the mistake of expecting foreign markets to mirror their domestic market in every material way. This may be particularly true in the area of corporate governance.
We avoid much trouble in international investing when we accept that some levers, such as corporate governance, are harder to pull than others, such as the price we are willing to pay.
When we go global in the search for investments, we give ourselves a free option to pay a lower price than might be possible in our home market. While no two equities are the same, similar companies frequently trade at materially different valuations across geographies.
Buffett’s concept of circle of competence, while typically used in the context of different industries, may also have applicability to different countries. Due to the many unifying features of global equity investing, we may falsely assume that our competence extends to investing in all geographies.
One of the biggest drivers of disappointment for investors who venture globally might be an unrealistic view of the promise of emerging markets. In the rush toward growth, many investors readily ignore the return-on-capital prospects of fast-growing but highly competitive and capital-intensive industries.
The issue of challenging demographic trends confirms the importance of calibrating fundamentals versus expectations, perhaps best explained in Alfred Rappaport and Michael Mauboussin’s Expectations Investing. When the expectations implied in stock prices fall materially short of the likely fundamentals (Note: e.g. negative demographic headwinds overly price in in the market), a buying opportunity may be at hand.
This chapter also includes a list of 50 international investors who may be considered value investing thought leaders in their respective countries, for example:
Kerr Neilson; Platinum; Australia
Richard Lawrence; Overlook; Hong Kong
V-Nee Yeh, Cheng Hye Cheah; Value Partners; Hong Kong
Over the last weekend (27-28 January), I attended the Value Investing Summit (VIS) 2018 at Expo. I bought the ticket at S$150 from someone who couldn’t make it after buying the ticket. Overall, it’s a good event (depending on the line-up of speakers) and well worth attending if you have the time.
There are quite many learning points for me, and quite some that reinforce (and shed slightly new perspectives on) what I already know (which is a good thing too). And it’s quite inspiriting to see so many Charlie Munger and Warren Buffet (‘s thinkings and wisdom) in the speakers in the room, in fact more so on the former, whom I have recently demonstrated a newfound appreciation for. And even more encouraging to know that most of them (especially Vishal and Hemant Amin, who compounded the capital that he manages at >30% annually for more than 14 years with a 10-stock concentrated portfolio) have very similar investing philosophies, strategies and processes as mine (which I found only after 2 years of investing and lots of readings), although of course, I am still way behind them.
I shall list down the more major learning points here, viewed in my own lens (and very drowsy eyes and practically nonfunctional brain on the first morning due to a late night (2am+) out prior).
Day 1 (27 January)
Kee Koon Boon – Hidden Champions and Value Investing
I have been following his articles for some time and so I have already appreciated quite some of his thinking and wisdom
But it’s good to finally see him in person, and understand more of his personality (he was more gentle than I thought, and very knowledgeable and well-read) and the things that drive him (including intellectual pursuit and value-adding to society)
Also, think resilience
Hermann Simon – Hidden Champions – The Vanguard of Globeria: Success Strategies of Unknown World Market Leaders
Hermann is the one who created the “Hidden Champion” concept. He is a German Professor (Doctor), author and business leader. He is also the chairman of Simon-Kucher & Partners, which specialises in strategy, marketing and pricing (he himself is a hidden champion to me, who has run his firm for more than 30 years)
Hidden champion is all around us, creating products/services that we use all the time, often unnoticed and hidden behind, which is why they have the potential to appreciate in value and compound its value for a lot of times
Listening to his talk prompts me to think whether the companies that I own or am looking at has the traits/characteristics of the hidden champions, which are good ones to have
Germany’s Hidden Champions of the Mittelstand – which refers to world-class, export-oriented small and medium-sized enterprises (SMEs)
He is here to talk about businesses (and not investing), but because investing requires understanding of businesses, therefore it helps. It also reinforces to me the idea that I should be focusing on understanding businesses (and the business model), not equities, thus the term business analyst instead of equity analyst as said by Warren Buffett
Examples of Hidden Champions that struck with me include: Wanzl (trolley), Flexi (leash), Essilor (optic lens), Paiho Group (velcro fastener), Wirecard (payment processing)
Laser focus in a niche (that’s how you produce superior value), but still replicate and scale globally (within that niche area), therefore providing avenue for growth. And mono-maniac (leader)
On digitalisation – For B2C is already very advanced; For B2B there’s still much room to go, therefore providing opportunities to businesses and we investors. This is because B2B digitalisation is usually more complex and hard to integrate/implement. For us, as investors, look out for companies that are in the space of, or would benefit from, B2B digitalisation – they provide stable (sticky) cash flows and are associated with high switching costs. In my mind, I run through the companies in my portfolio, and I can only think of Silverlake as more of playing in this area. I shall hunt for more such companies
Joshua Zhang – Case Study
Joshua is an analyst with the Hidden Champion Fund I believe. His presentation was good and solid, with very organised thought and thesis flow and good slides and presentation skills, and I still have a long way to catch up to that type of level
He presented on Kadoya Sesame Mills (JP: 2612), which is a hidden champion
Laser focus on sesame oil; strong moats – culture, know-how (160 years of experience and knowledge)
Interesting company and maybe I would examine at some point if the materials in English are not inadequate
周贵银 (Zhou Gui Yin) – The Power of ROE (in Mandarin – interpreted)
One of my two favourites (together with Vishal)
周老师 is from China and he is a super Charlie Munger (lateral and multidisciplinary thinking), and presented on his 觉悟智慧 (and/or 融道智慧), which discusses the integration of the Chinese philosophies and ancient thinking (佛家思想,,易经,道家,儒家,佛家,兵家,老子,孙子,etc etc) with investing
Overall, I think these points are very good in shaping and building up one’s character, emotional control, temperament, life philosophies, which are at least as important as, if not more than, diligence, IQ, analytical work and number crunching, etc.
These are very high level and more philosophical, and somehow I appreciate it a lot. But I think I am still not at a stage to start studying those Chinese philosophies and teachings to really master the points, and shall leave them to a later stage when I build up more of the other areas first
Some of the points that I like/connect more are:
佛家思想 – 三大境界/领悟:看山是山,看山不是山,看山还是山 – Static dynamism (and in another perspective (in my own words), one can see it as the zoom-in-zoom-out approach/mental model which is very useful in investing)
内圣外王 – 行者 – 无,空 – 只拿不给的话,会导致欲望越来越大,导致我们不能客观 – Be very wary of this, which I think is very true –
道家 – 无,为 – 不要过意的去干悟它 – Time is the best friend of a good business
泰来否极 (always be on the look-out for any potential downfall or disaster – humility and constant cautiousness (like Howard Marks)),而不是否极泰来 (please don’t bet on this – in real life it doesn’t work like this)
长久 – Not short term profiteering/compounding, but permanent compounding
兵家 – 未战先胜 – I win (or make money) the instant I bought the stock, just like what Warren Buffett says, because I have done my homework/diligence and know the value of the company (that I am buying)
See my notes and more points in the pictures below
Panel Discussion – Hemant Amin; Francois Badelon; Hermann Simon; Kee Koon Boon; Judy Goh; Clive Tan
On Circle of Competence:
Hermann Simon
Slightly irrelevant topic – The less known a CEO is in the public, the more successful the company becomes
Hemant Amin
It’s not competence if you don’t know the extent of the circle of your competence.
We use a bit too much IQ (exploring intellectual challenging and complex areas/companies/business models) than we need
It’s okay not to have an opinion on things you don’t know (we use, or fall back, too little on the “too-difficult box”
Define what you know, and stick with it
Kee Koon Boon (some points are on different topics)
Charlie’s mental model – multidisciplinary thinking
Idea of resilience
He likes learning knowledge and likes to know what makes people rise and fall, and that partly leads him to examine company leaders and then businesses and investing
Investing is a multidisciplinary area
He first developed accounting skills, then psychology to understand CEO’s or human’s mind
Duality of a leader (note: duality mental model at play here) – Needs to be tech savvy, and also needs to always have customers’ needs in mind
On screening criteria and habits to develop
Hemant Amin
Let’s look at what not to screen for (note: inverse thinking mental model at play) – Not growing well, not scalable, not good management
Is there a temporary problem? That’s where the opportunities lie
Idea sources: Reading, reading, reading (this is what this business is about); Connecting the dots (this inevitably leads us to insights)
Habits – Reading across diverse sections
Hermann Simon
Personal visit of companies is the most valuable information source
Kee Koon Boon
I’m a mono-maniac. I keep working and adding value to society, because I believe in my work (and that it adds value to society). This is the habit I work on
Day 2
Vishal Khandelwal – In Search of Value in an Irrational World
Finally got to meet Vishal (or rather I would prefer to call him the Safal Niveshak (the successful investor), after following his website and (epic and wisdom-filled) articles for more than two years. So, of course, I have to take a photo with him (such a rare chance)! The Warren Buffett of India!
Anyway, coming back to more serious topic, he presented very well (even though he kept saying that he hasn’t spoken to such large crowds before (he said so too for his previous video interviews)) and presented very useful concepts (more on the high level and strategic points, and temperament). Although I have known most of the concepts/points (mainly through his writings), it’s good to hear them again right out from him and get reminded of those lessons again.
And it’s also good to have met him in person, heard him spoke in person, talked to him and asked him the questions that I have (casually after his session on-stage) in person, and just have a feel of him as a person and understand his personality and the way he speaks/talks/holds himself. Because with these, the next time I read his writings, I would be able to picture him talking to me (note: thought experiment mental model in some way) and therefore able to learn and absorb/internalise those lessons better.
Also, it’s also surprising + lightening to see that (in my own view) he is very much Charlie Munger (or at least uses more of Charlie’s thinking skills in his own thinking) than Warren Buffett (although he learned a lot from Warren too, especially on investing), which proves to me that Charlie’s thinking models and skills are so wonderful that so many successful investors copy and practise them constantly and proactively, and makes me want to learn + implement + practise more of Charlie’s thinking (I am glad that I have read Poor Charlie’s Almanack and learned more about Charlie (‘s thinking and personality) before I heard from and met the speakers in VIS). Just to illustrate, within my first few minutes of conversation with Vishal, he already brought out two mental models (of Charlie’s) – inversion and pre-mortem – which I shall allude to below.
I really want to just list down the most important points that I got from him (note: focus), so here they are (see the more detailed notes in the pictures below):
We are not rational. We make an argument first. Then we try to rationalise it. (Be very aware and wary of this, making sure that you don’t fall into this)
Learning to say NO! (to various info sources, to noises, to (bad, unaligned, or even aligned but decent only) investment opportunities) is one of the most difficult, but important thing to do. Learn to say NO (time is one of your greatest resources/capital that you should allocate well as a good capital allocator)!
Think LONG TERM and have a LONG VIEW! The long view (and long term focus) is an edge that we retail investors have. Look at seasons, not quarters, and one season is maybe 5 years or so (depending on the industry)
Focus on the PROCESS, not the outcome. Also, focus on what we have control over (risk, cost, time, behaviour) (which we rarely focus on), not what we don’t (outcome, stock price) (which we only focus on)
Investing is 51% ART, 49% science – I base my thesis and purchase decisions on what my GUT tells me after I’ve done all the research and absorbed all the info (the science).
Beware of over-focusing on and be careful when using valuation, as all valuation is wrong, and all valuation is biased (since we have already spent a lot of time looking at it) (note: consider the importance of, and use of, margin of safety here)
To avoid confirmation bias, especially when you are holding for long term, and leveraging up, a solution is to write down your thesis in an investment pad (you should have one), not on computer. Write down why you buy, and why you sell.
His answers/points on the personal questions that I asked him:
Be patient and keep doing the work
If you can find only companies with high ROIC but little reinvestment opportunities (note: I think Vishal sees this type of company just like another cheap (value) company, which I think he doesn’t want to focus on), but not companies with high ROIC and much reinvestment opportunities (or if you are not willing to pay for them after you find them, either due to the really high or over- valuation currently, or because of your own psychological/mental barrier), then do these two:
(1) keep finding, keep doing the work, keep flipping the stones (if the thesis for no. 1 doesn’t work out now (maybe because it’s expensive), go down the rung, look at no. 2, no. 3 in the market (in terms of market leadership (note: which is different from market share)), but don’t go further than that; and
(2) be patient and wait for market crash (or correction is also good enough) if it is really overpriced (note: the same thesis might work out in the future too as time passes, not just from the decrease in price, but probably be due to the improvement of business and increase in earnings too – remember, there are two factors, not just one); or be more willing and ready to pay for quality, which requires you to really understand and appreciate Quality – compounding quality gives you a lot of ROI, so learn to understand and appreciate the value of quality (which is not easy, but work on it)
And to help understanding and conceptualising the value of quality (and (probably non-linear) growth), Vishal uses/considers an expected return model as one of his tools (note: I believe he has not just hammers, so he doesn’t see everything as nails) (note: the far-out earnings and corresponding valuation can be used to understand/estimate a business better, but not as the main basis for investment/justification for a high purchase price).
First, estimate the earnings of the company 10 years down the road (have a long view, and this helps to take into account non-linear/ exponential dynamics).
Second, apply a multiple. He personally uses a P/E multiple, and not EV/operating earnings. The important point is to be consistent, applying the same type of multiple across companies consistently – and in response to my follow-up question, he says that difference in or issues on interest expense, capital structure, etc should be taken into account in the estimated earnings (to go with the P/E multiple), and not taken into account by the tool (it is a tool!) (the type of multiple).
Third, see whether the implied valuation range (remember, never have one single valuation number – always a range) gives you an annual return of 15%-20% (or whatever your number is), based on today’s price
In estimating the long-term earnings of the company, use inverse thinking (e.g. think about what would make the company not achieve that level of earnings, etc; or what level of earnings would the company not achieve). Use Charlie’s pre-mortem concept too
Also, force yourself to think about and imagine the long term potential growth. When thinking on this, think about per capita consumption now. E.g. If there is 1 out of 100 people consuming the product/service now, in the future if 5 out of 100 consume, then it’s a 5x growth, just in volume.
Hemant Amin – Value Investing in an Exponential World
Hemant is a local fund manager that manages a family fund of more than S$100M with a concentrated portfolio of 10 stocks, fundamental long. And a track record of >30% IRR for ~14 years – Impressive (with a good process)!
He focuses mainly on (owner-managed) companies with high quality and high growth (best case), followed by companies with high quality and less growth.
Understand business models! Then you won’t say the valuation (EV/EBIT) is high
Largest position is in Bajaj Financial Ltd
Business models + Technology + Scalability = Exponential Growth! (see picture below)
Exponential growth – You have to think NON-LINEAR in this linear world – The rate of change itself is accelerating – Spot the slow boiling water, and make sure that you are on the other side
Think about when does a company moves on the exponential curve (low marginal costs, etc)
Understanding business model allows you to understand where the value is (value investing)
Warren Buffet: “Investing is simple, but not easy”. Simple is deceptive
Be wary of conveniently extrapolating historical results/data – Else librarians will be the best investors
Investing is about connecting the dots, and finance is just one tiny dot
Business models are on steroids in the exponential world (see picture below)
Fish where the fish are – Decide where you want to fish (whether you want to fish only the high quality high growth fish)
Management is not a moat, but his actions affect the moat
Invest in “technology” (not necessarily technology companies), and your circle of competence on it – Ask how will technology scale your company or destroy your company
Elephants (e.g. Google, Amazon, Visa, Microsoft, Adobe, Salesforce) can dance – Size can be a big advantage; Competition is for losers – Wait for good market opportunities for these dancing elephants
Portfolio composition is key – Hemant’s top 5 positions take up 7%, top 10 positions take up 95%
The zoom in, zoom out perspective/approach – E.g. Ask, can this business double in 3 years (24% p.a.) or 5 years (15% p.a.)?
You need to have the discipline to be comfortable with LOW ACTIVITY, HIGH LEARNING, SIMPLICITY (read, read, read and do nothing else)
Charlie Munger: “Simplicity is a hugely underestimated edge in investing and in life”
Q&A: How do you control risks with a concentrated portfolio? (I personally this question, or rather the answer to this question, is very good and useful for me)
Hermann: We do not go out and buy 20% position in a company straight (by doing this, you’re saying that you’re GOD and know everything). We buy <5% every time (start small), then as time goes, we know better and better and more about the company (and the industry), then we accumulate more to a bigger position
Side point: Mohnish Pabrai has a concentrated portfolio too, and sometimes he got burned
Vishal: Think like a parent (borrowing from Phillip Fischer) – only manage the amount that you can
Q&A: Valuation method
Vishal: Warren Buffett talks about DCF, but Charlie Munger says he has never seen Warren done one – ROFL. I personally use multiples (note: good to know that I am on the same page with Vishal here)
Hemant: Even the CEO of the company can’t predict 10 years cash flow, how can you? Remember, our world is dynamic and businesses react
Q&A: Timing the market?
Hemant: Crash is relative to your understanding of the business – see it as owning a private house. We are stuck in the psychology of portfolio management (note: I can’t really recollect the essence of this point now)
Vishal: Quality is in itself a margin of safety – The longer you hold, the better off you are. Conversely, the longer you hold bad businesses, the worse off you are (note: water the flowers, not the weeds)
Hermann Simon – Hidden Champions – Role Model for Leadership in the 21st Century
This is Hermann’s second part
Best bottling company – Kronos (America) – It was achieved by the fearlessness of the founder – with courage (a trait of hidden champions), not with strategy
To internationalise and be a global leader, you need long term perspective, long-term orientation, and have the orientation, stamina and perseverance to run the marathon – Strategy is not a short term mater
Look out for CEOs with long tenures (note: ask, what’s the CEO tenure for your company?) – What can a CEO build in only a few years?
Average tenure of large corporations: 6 years
Average tenure of hidden champions: 20 years
Average tenure of records – Hans Riegel (Haribo bears): 67 years
Employees: Look for high productivity in hidden champions
High productivity indicators: High qualification (uni degree) – Knowledge > Cheap labour in this world of globalisation
Employee turnover rate – Hidden champion has 2.7% turnover
Hidden champions have deep value chain
Total quality control – E.g. Wanzl trolleys
Faber Castell – We grow our own wood in our own plantations – Consistency in quality
No outsourcing of core competences
Uniqueness can only be created internally – If you buy from others, your competitors can do the same too
Intervarsity Stock Research Challenge Presentation Finals – Judge Panel: Hemant Amin; Hermann Simon; Kee Koon Boon; Francois Badelon
5 companies were presented. I only managed to hear the first 3 and had to leave. Overall, I felt that they had done a lot of homework and research, but the companies all have some certain negative points that made them not compelling.
Hamamatsu Photonics (TSE: 6965) – World leader in PMTs, with dominant market share. But low margins, low ROE and low growth rates – Maybe problem lies in sales and marketing front (low asset turnover)
Time Technoplast Limited (BSE: 532856) – Polymer drums – Be careful that high market share does not necessarily translate to high market leadership (for high-value products)
Nihon Kohden (TSE: 6849) – EEG market – electronic medical equipment. Has broad product range for hospitals that are compatible and integrate with each other (including hardware and software). Recurring consumables. But, low historical growth and sub-par gross margins compared to Johnson & Johnson and others (e.g. Medtronic). Suggestion: Look at its Japanese competitors, Sysmex, which has high export %, better margins and high % of consumables
Ending thoughts
That’s all for Value Investing Summit 2018. I am glad that I attended it, with the most valuable part being able to meet the few great investors from the world and learning from them.
VIS 2019 will be held in Kuala Lumpur, Malaysia on 19 and 20 January 2019. I shall consider attending if it has a good line-up of speakers (good value investors, like this time), so I shall wait for more details first.
Today, I finally finished this book – Poor Charlie’s Almanack – after 3 months (I also finished another book – Morningstar’s Why moat matters – during this period).
Although this book is not easy to read (partly because of the nature of the content, and partly because I am reading the traditional Chinese version, instead of the English one), and at first I was having second thoughts on how much would I actually get out from this book, I managed to finish it in the end and I would say it is actually very worth it.
Overall, this book allows me to understand Charlie Munger as a person, and (take a peek at) what’s going on inside his mind, better, just like how the other two books (The Essays of Warren Buffett, and Tap Dancing to Work) that I have read helped me to really get into Warren Buffett’s mind and get to know him better and understand his thoughts better, and have some glimpse of his personal life. Charlie is really a very different guy from Warren, is an impressive thinker, a lateral and multi-disciplinary thinker, with diverse interests and powerful mental models ready on hand anytime.
There are many useful points that I learned from this book, but I would just list down the few that are more important to me (to really appreciate the ideas/concepts, you would have to read the book, or at least, articles discussing them in detail):
Inverse thinking – Inverse. Always inverse. Thinking in an inverse way will help you to cover more grounds, and at times give you answers that you cant obtain by not thinking inverse.
Thinking and mental models – Learning how to think is at least equally important, if not more, than thinking itself. And mental models would help us much in thinking, in terms of organising our thinking well and retaining and linking knowledge better.
Checklists – For god’s sake, have checklists and use them as a tool to aid our thinking. Our human brain is just not powerful enough to remember everything and help us to cover all the important points, when we are processing information or making decisions, especially when human are very susceptible to all sorts of cognitive/behavioural biases ingrained in our genes (which hit us without even ourselves being aware of them). Having and using a checklist will help us greatly in life, and save us from a lot of troubles and help us in making less mistakes. Pilots use checklists to help them, so why shouldn’t we. And Charlie Munger has his own checklists too (since then, I have developed my own checklist of around 140 questions as it stands now (which will, of course, evolve over time), that I shall go through and ponder about before I make my investments in any company).
Study psychology, and learn and master the various cognitive biases that we are susceptible to – The good thing about Charlie is that he manages to show us how we can use psychology theories and ideas in our near life (instead of just theories that matter in academia or in clinics), and how important they are. The 25 cognitive biases that he discusses in Chapter 11 of the book are so invaluable and useful in our daily lives (not just investing, although they matter a lot and are very useful in investing too), that I shall list them down here (which itself is a checklist that we (or at least I) should use):
Reward and punishment superresponse tendency 奖励和惩罚 超级反应倾向
Lastly, I really respect and admire Charlie’s dedication, hardworking and lead-a-simple-life attributes, as brought out by William H. Borthwick’s commentaries on Charlie (as quoted below), which I think is the way to go in life.
“在明尼苏达还有许多这样宝贵的小故事,因为当时查理工作太忙了,在那儿是我们唯一可以真正以他在一起度过的时光。平时工作时,他总是天没亮就出门,吃晚饭时才回家,接着研究标准普尔指数,然后跟华伦(巴菲特)通一两个小时电话。”
-威廉。波斯伟克(William H. Borthwick)
P.S. Much appreciation to Daniel from 10% per annum for being kind enough to provide me with this wonderful gift. Thanks Daniel! 🙂
In the previous post, we talked about the five reasons why I think Capilano is worth looking at. Today, we will discuss what are the risks and how much I think Capilano is worth.
Bees at hives
Honey with food
What are the risks?
Now that we have looked at all the positive points about Capilano, let’s consider the risks that Capilano faces:
Honey production risks: The amount of honey crop is highly exposed to weather factors that are uncontrollable by the beekeepers. Bad weather conditions – too cold (the honey bees might die, or they need to consume more of their own honey to generate heat during cold winter), little rain or dry conditions (means less amount of nectar around for the pollinators), strong winds/cyclone (flowers and buds would be knocked off plants, resulting in less nectar available), El Nino, and warm winter (this is cited by an analyst report, to which I don’t understand why) – and pest/diseases can seriously jeopardise the honey crop for that year, and affect both the amount of honey stock (an important ingredient to ensure a smooth business operations) and the level of sales and profits.In my opinion, this is the biggest risk that Capilano, and all other honey packers/producers, face. However, I see this risk as affecting more of the short term business performance (which does not concern me with a long-term view that much), and less of the long term. This is because the stronger players with better cash flows and balance sheets would be able to hold out until the honey season turns better, and still perform reasonably well on average in the long run, unless the bad weather is prolonged over many many years. In fact, the big players might actually end up benefiting in some form. For example, in FY2015, where honey crop was really bad, Capilano took advantage of the situation of lack of honey supply in the market to procure honey and push its market share from 50% to 70% in the Australian market. Overall, I would monitor this risk by keeping an eye on the weather developments and the honey stakeholders’ (Capilano’s, its competitors’ and bee associations’) commentaries on honey production and seasons over time;
Strong competition and expansion risks in overseas markets: Although Capilano is very strong in the Australian market, it is less so in the other markets, which it intends to expand its activities. For example, China, a strategic market which Capilano chooses to focus on, has already seen the New Zealand players, for example Comvita, developing and solidifying their bases there for some time, setting out distribution channels and partnerships with local firms. Although the overseas markets are still big enough, I would expect strong competition and retaliation/activities by the competitors, and therefore Capilano would have to plan and execute well in order to establish itself well and expand in those markets;
Pricing power in Australia: Beekeeping and honey farming are very labour-intensive activities, especially for Manuka honey, and increasing labour costs would exert pressure on Capilano’s profitability. If Capilano is not able to pass on all the costs increase down to the distributor/retailer that sells to the end consumers, Capilano’s margins would suffer. In this regard, Capilano mainly sells to the big supermarkets in Australia (e.g. Coles and Woolworths) that have great bargaining power, so Capilano would face some pressure from this side too. Earlier, we have already seen Capilano’s gross profit margin declining from 46.3% in FY2013 to 41.5% in FY2016, although it started to stabilise and recover to 42.3% in FY2017. I think that this ties in to some extent with the first risk (honey production risk) too, as a bad season would see the beekeepers producing less honey and therefore demanding higher prices for them (which means higher costs to Capilano) to stay in business, which is probably what’s in play to a certain extent on Capilano’s declining GPM in the past few years (despite its switches in product mixes to higher margin products);
Other risks, which include stronger competition in the Australian domestic market (which I think the risk is relatively lower given its stronghold), economic slowdown impacting honey demand, in Australia and/or the export markets (honey, especially Manuka honey, is more of a premium product, which people might consume less during economic downturns), acquisition risks (Capilano’s inability to manage and integrate its future acquisitions, including beekeeping operations, well) and overall development of the Australian Manuka honey industry (for e.g. the Kiwis are currently trying to trademark the use of the word “Manuka” to restrict to only honey produced in New Zealand, which of course, the Aussies stood up to fight against, and challenges on the scientific evidence of the superiority of health benefits of Australian and Manuka honey).
How much is Capilano worth?
And finally, the golden question – How much is Capilano worth? Or rather, how much am I comfortable with considering a position in Capilano (as valuation is an art, and there is no single right answer), as a good company can make a bad investment given the wrong price, and a bad company can make a good investment given the right price. Thus, value investing (value vs price).
Given that Capilano’s debt is minimal (considering its past capital structure) and I expect that its maintenance capex should be close to its existing D&A, to keep things simple, I would value Capilano using a multiples approach (which I commonly use), and in particular just a simple P/E ratio, instead of a EV/operating profit ratio.
Before I discuss my valuation, let’s recap some of the important items that would affect the valuation:
in terms of growth, the CAGR from FY2013-2017 for honey sales volume, revenue, gross profit and PAT is 12.6%, 16.5%, 13.9% and 31.6% respectively;
In terms of return on capital, the ROE in the past two years (FY2016 and FY2017) is around 17%, with the most recent 16.6% of ROE in FY2017 achieved with the lowest equity multiplier (of 155%) compared with the past few years. The incremental return on capital, based on the CAGR from FY2013-2017, is between 17% to 24% (16.5% for RONA, 19.5% for RONE, and 23.6% for RONIC (remember RONE is, in my view slightly depressed, and lower than this RONIC due to the pare-down of debt)) during a period in which it deleveraged its balance sheet (i.e. reducing the equity multiplier) and building up its inventory (which increases asset base, thereby reducing asset turnover), which means that there is room for potential improvements for its incremental returns on capital;
in terms of capital allocation, its past dividend payout ratio has been around 35% – 40% since IPO;
in terms of balance sheet, as at the end of FY2017, it had a net debt of AUD 7.8m (AUD 9.0m of debt and AUD 1.2m of cash), receivables (AUD 24m) that were greater than its payables (AUD 21m), and an inventory of AUD 44m.
And here’s how I value Capilano:
I value Capilano under three scenarios, which is normally what I do, being a conservative scenario, a reasonable scenario, and an optimistic scenario;
I start off with Capilano’s latest PAT in FY2017, of AUD 10.3m;
This FY2017 PAT, based on just accounting numbers, was overstated by one-off net gain of AUD 0.74m (gain on sale of beekeepers assets of AUD 2.07m, minus the downward revaluation of honey stock due to low honeyprice of AUD 1.33m);
However, in my opinion, there are a few other factors that suppressed the FY2017 PAT – (i) losses from its two JVs totalling AUD 0.37m (loss of AUD 0.12m and AUD 0.25m for WA and Medibee respectively) due to start-up phase and bad honey season for WA, (ii) temporary issues for overseas sales, with FY2017 overseas sales declining by AUD 5.2m compared to the previous year, mainly due to tough international market (which is recovering now) and exiting of less profitable markets and products (which is more of one-off nature, and that the company can focus instead on sales of its honey stock in more profitable markets), and (iii) the increased spending of marketing costs for new products (Beeotic) of AUD 2.2m, of which either the costs would taper down after a few years (the company currently still wants to push this product a lot), or these marketing activities, if successful, would result in higher revenue which pulls up the PAT; and
Therefore, I choose to make a net uplift to the FY2017 PAT of between 0% to 10% for the three scenarios, to arrive at a sustainable/normalised level of PAT going forward, for me to apply my assumed P/E on. I consider this 10% max net uplift (of around AUD 1m) to be reasonable, given the substantial decline in overseas sales of AUD 5m which could potentially recover (either soon or in one or two years’ time). This would be something that I would monitor in Capilano’s FY2018 H1 and full year report, to see whether my assumption is reasonable and whether any adjustment is needed;
For P/E multiple, I use a range of 15x to 18x for my three scenarios, with the mid-point of 16.5x for my reasonable case.
For my conservative scenario, I see it as a worst case scenario where Capilano does not garner any substantial growth in the future, and merely keeping up with inflation or rise in costs. In this case, given Capilano’s strong ability to convert profits into cash flows and low capex needs, I deem a 15x P/E, or 6.7% earnings yield, to be sufficient for my appetite, since it can almost distribute all of the 6.7% earnings yield as dividends, although this scenario is highly unlikely given the short term growth opportunities still available to Capilano;
For my aggressive scenario, I choose a P/E of 18x, which is lower than its CAGR (FY2013-2017) for profits of 31.6% (which is artificially boosted by enlarged equity base) and closer to its CAGR for revenue of 16.5%.Now, let’s try to put the returns on capital into the equation. I would say I would expect Capilano to be able to achieve incremental return on capital of between 19.5% (based on its past RONE) and 23.6% (based on its past RONIC). To be conservative, I would use a lower number of 20% for my valuation. This means that my assumed P/E of 18x is still reasonable as it is lower than the 20% incremental return on capital (which, in most cases, sets the upper limit of the level of earnings growth). This also means that if I want a PEG of 1x, my assumed P/E of 18x would entail the company reinvesting about 90% of its earnings, which is possible, but unlikely.As a side point, if Capilano takes on slightly more leverage (than its current net-debt-to-equity of 13%) and can manage its working capital, especially inventory, better, there are still rooms for improvements for its incremental returns on capital;
For my reasonable scenario, I take the mid-point of the two P/Es above, resulting in an assumed P/E of 16.5x, which I consider quite reasonable. If not for the high exposure risk of honey production to weather conditions, I would be more comfortable with paying a higher P/E.In addition, to achieve a PEG of 1x, or earnings growth rate of 16.5x, this means that the company has to either reinvest 83% of its earnings, which is unlikely (but still possible if there are sufficient reinvestment opportunities) as it is higher than its past reinvestment rates of 60% – 65%, or take on more leverage to boost its equity returns, or achieve an incremental return on capital of 25.5% (assuming 65% reinvestment rate), which is slightly higher than its past RONIC of 23.6%, and is possible.At a reinvestment rate of 65%, the growth in earnings of Capilano would be around 13% (= 20% * 65%). Also, at a P/E of 16.5x and an assumed dividend payout of 35%, this would mean that my dividend yield would be around 2% (= 1 / 0.165 * 0.35).
I deduct a net debt of AUD 7.8m from my valuation, to be conservative (although this is theoretically wrong given that I have used P/E, instead of EV/operating earnings, in the first place). I would say this is quite conservative, given that if we look at Capilano’s last working capital position, its receivables is higher than its payables (by a few millions) and it had a closing inventory of AUD 44m, which it had paid in cash for and could use to generate revenues and profits without incurring any cash costs (although acknowledging that it would require a reasonable level to inventory to run its operations, which in FY2014 and FY2015, it was surviving at about half of the current inventory (AUD 14m and AUD 23m respectively, although it has a much larger operations now with more JVs and acquired companies).
Based on these assumptions, I value Capilano (see table below), in today’s terms, at around AUD 170m to AUD 200m, or around AUD 18 to AUD 21 per share, based on my reasonable and optimistic scenarios. In my conservative scenario, which I consider to be a very unlikely worst scenario, Capilano would still be worth around AUD 150m (or AUD 15.50 per share) as a floor.
Going with my reasonable valuation scenario, I would expect my returns from being a partial owner in Capilano, based on a 35% dividend payout, to come from a 2% annual dividend yield and the capital appreciation of Capilano arising from an increase of its operating earnings by around 13% per annum, giving me a total return of approximately 15% per year. This 15% total return is purely a guide, and of course, would be affected by both positive and negative fundamental developments over the years, and the lack of adequacy of my analysis. Hopefully, I would see more positive developments (e.g. a recovery to a higher level of normalised/sustainable earnings, and/or higher RONIC, arising from either better pricing power, better asset turnover, switch to higher-margin products, more efficient operations, good honey seasons, etc).
On the last point, Charlie Munger always likes to say that “all I want to know is where I’m going to die so I’ll never go there”. Putting myself in this shoes and thinking what could kill my investment in Capilano, I see the worst worst case scenario as one where there are:
prolonged bad honey seasons (due to bad weather/diseases/crazy human acts resulting in bad crops and/or death of honey bees);
worsening of Capilano’s performances in its export markets (due to increasingly stronger competition) and probably its local market too (declining gross profit margins, or if competitors decide to scale up or undertake price cuts in good honey seasons);
strong retaliation from competitors in the China market (in which it intends to strategically invest in (which requires capital)), resulting in prolonged price wars;
cock-ups in its two JVs (maybe due to inexperience in bee farming);
sabotage of Capilano’s branding in Australia (we have seen one in 2016, in which Victorian apiarist Simon Mulvany waged a social media campaign against Capilano, accusing it of selling “toxic”, imported honey and of using misleading labelling);
departures of key senior management, including Ben McKee who has been appointed as CEO in 2012 and MD in 2013; and
New Zealand winning its bid to trademark “Manuka” honey, which would create a mess for the worldwide Manuka honey market.
In a simulated quite awful and unfortunate case, with probably up to four of the factors above happening at the same time, I see Capilano’s profits dropping to around AUD 7.5m (about 73% of its FY2017 profits), and at a P/E of 15x, it would be worth around AUD 110m, i.e. ~35% less than my reasonable valuation of AUD 170m. Hopefully, I won’t get to validate the accuracy of such a valuation. In any way, forcing myself to think about these disasters, or where I would die, would make me more alert to which are the most important factors to monitor and stop me from going there (hopefully, in time).
Note: This is not a recommendation to buy or sell. As with all (value) investments, it’s of utmost importance to do your own due diligence. And as Peter Lynch puts it, “know what you own, and know why you own it”.
Disclosure: The author has long position in Capilano as at the time of writing.
P.S. If you want to receive updates on my future posts, do subscribe to my blog by using the subscribe function (on either the right or the bottom of the page).
When nothing seems to help, I go and look at a stonecutter hammering away at his rock perhaps a hundred times without as much as a crack showing in it. Yet at the hundred and first blow it will split in two, and I know it was not that blow that did it, but all that had gone before.

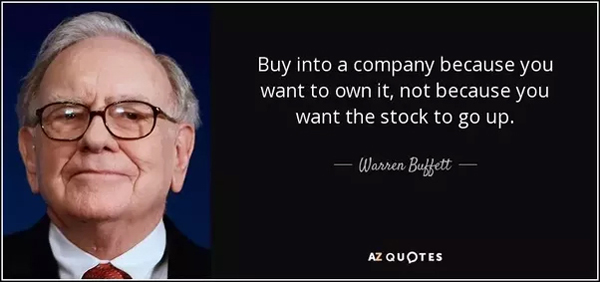
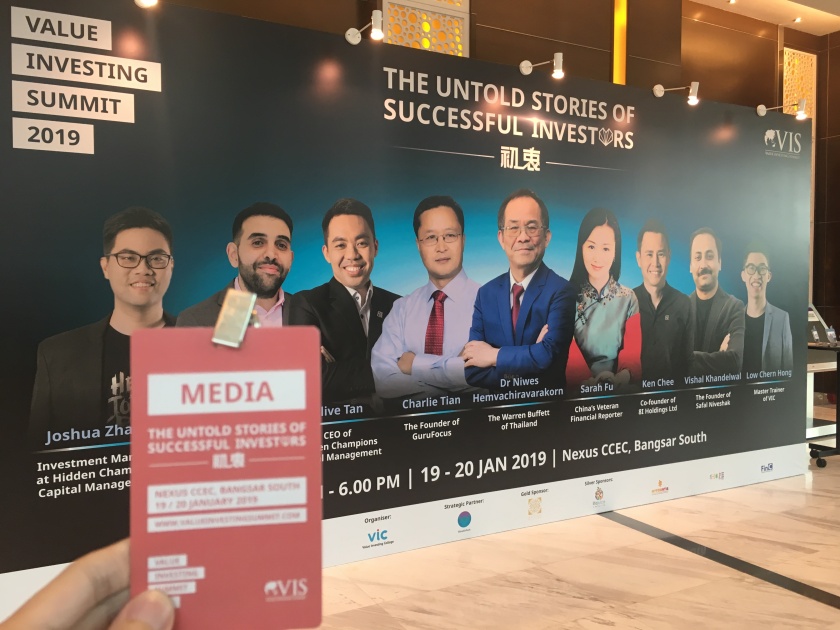
")
")
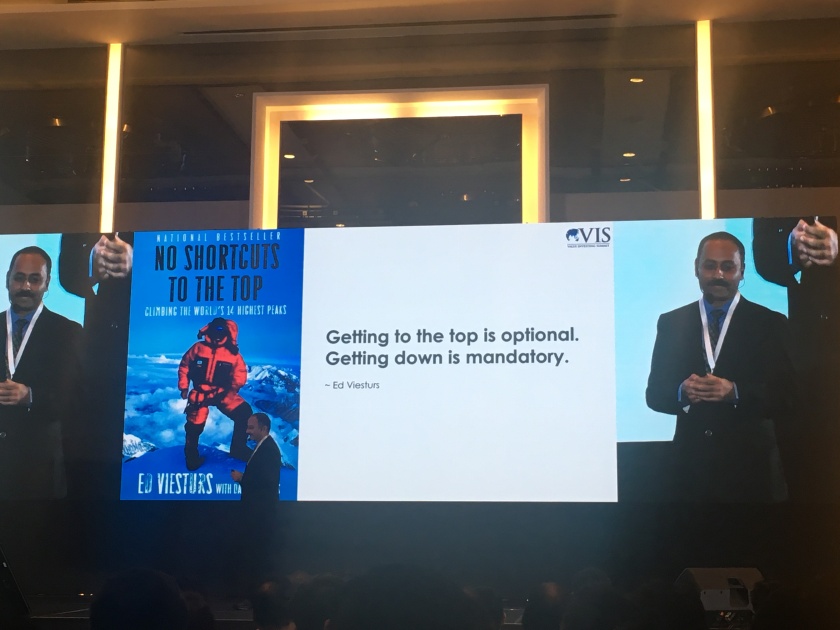
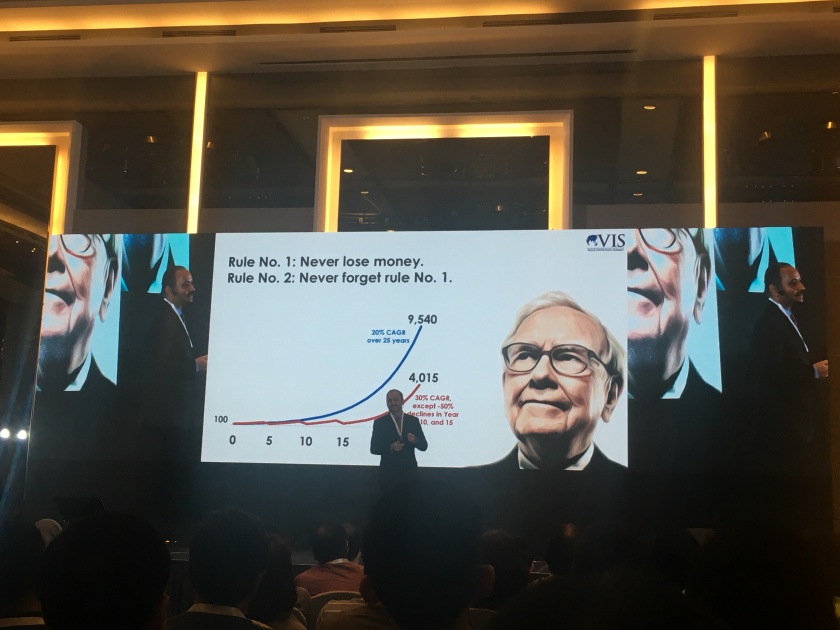
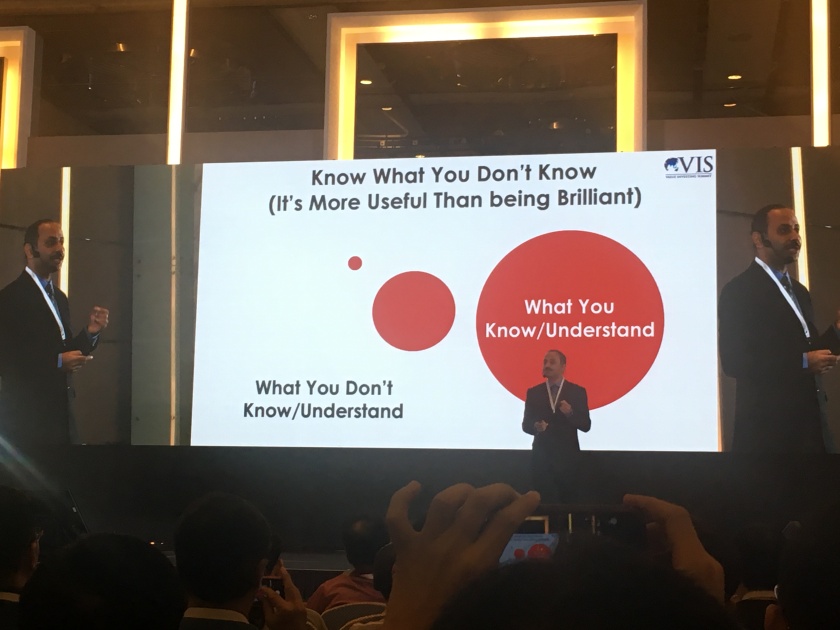
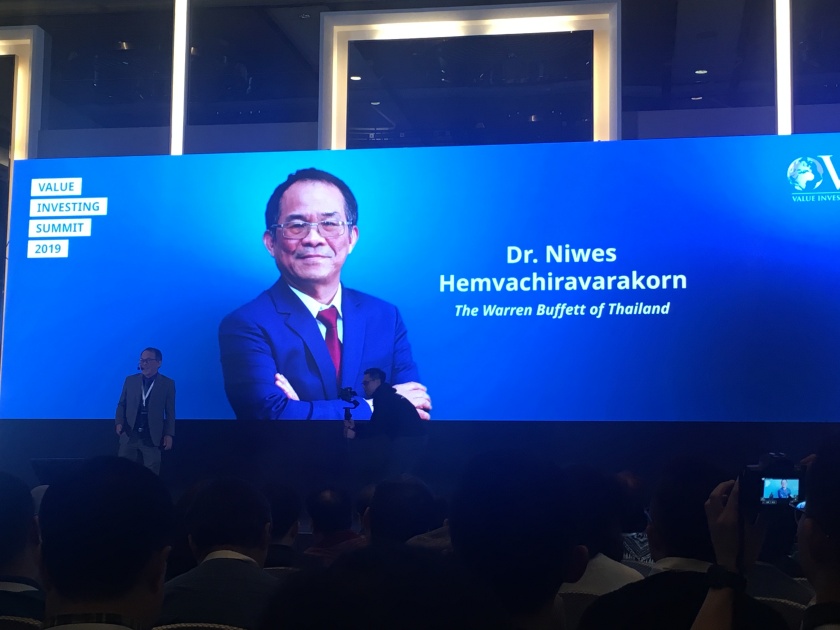
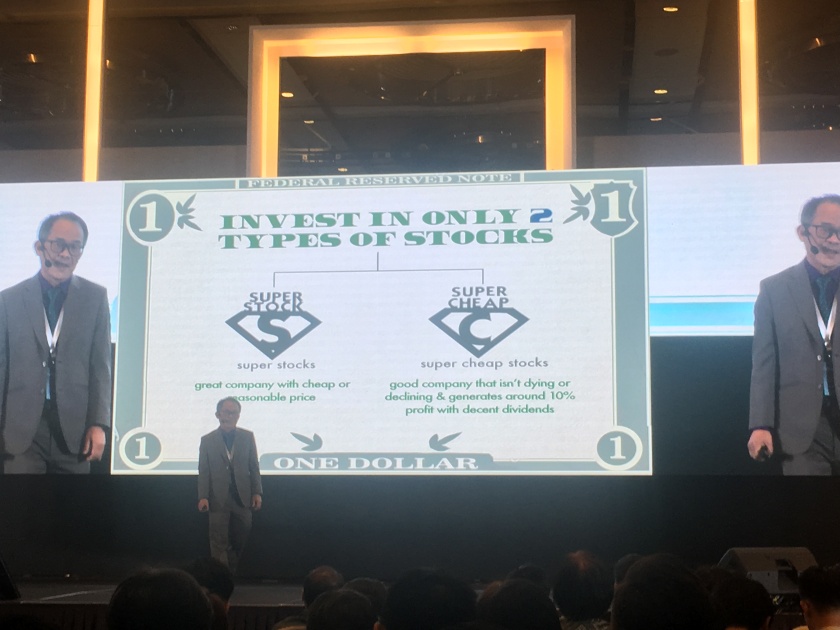
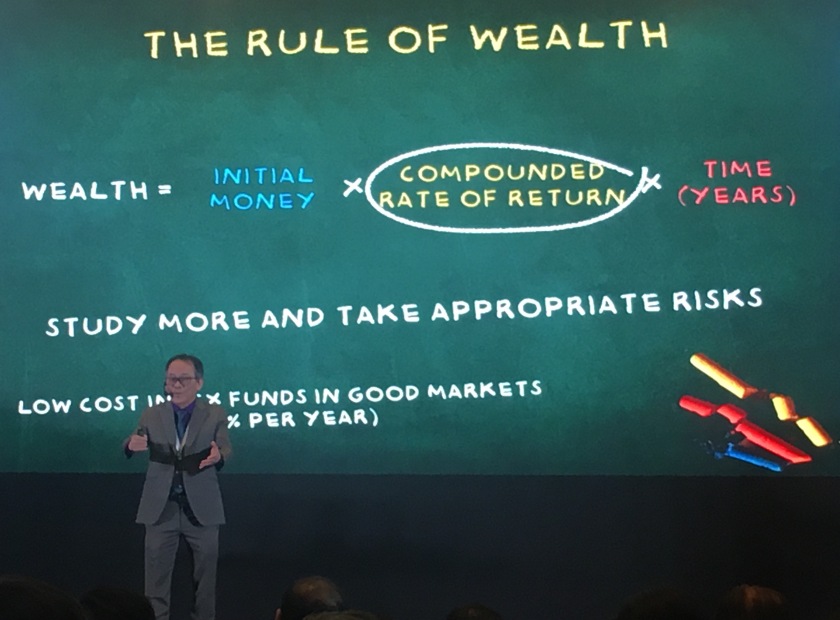

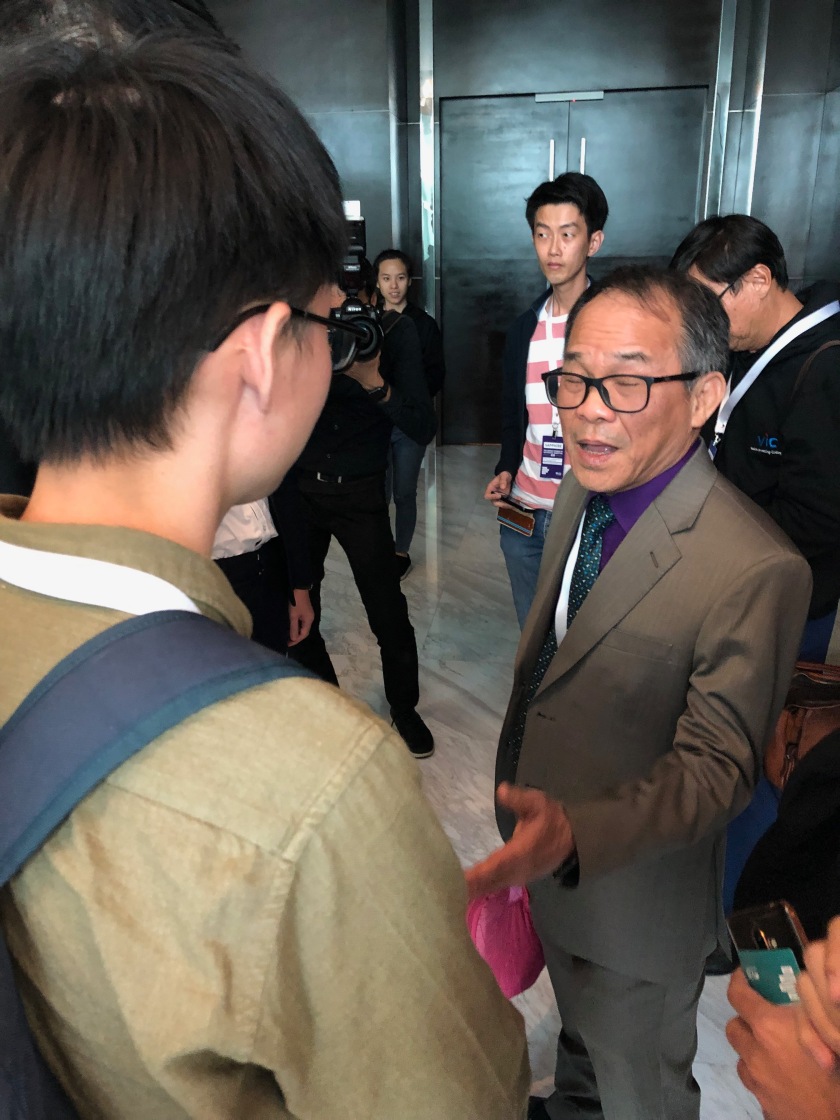
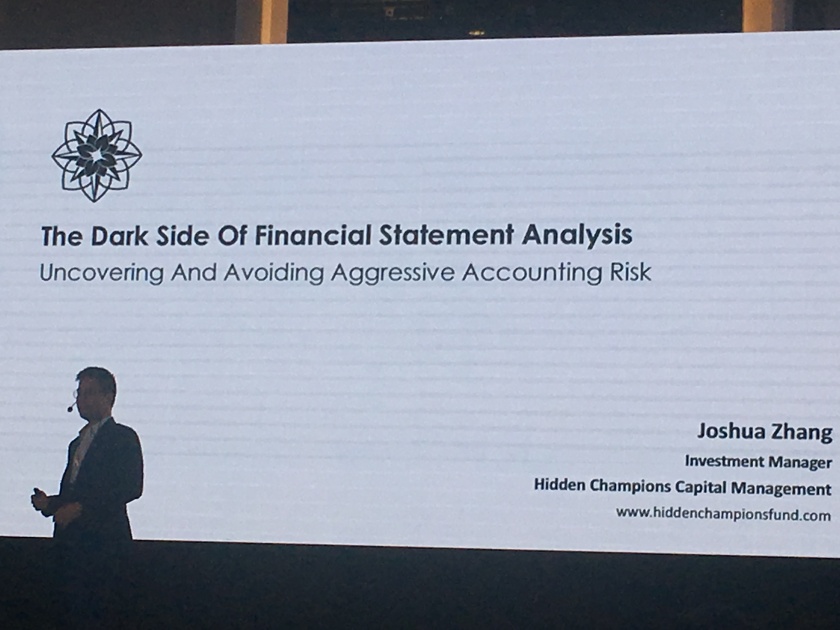
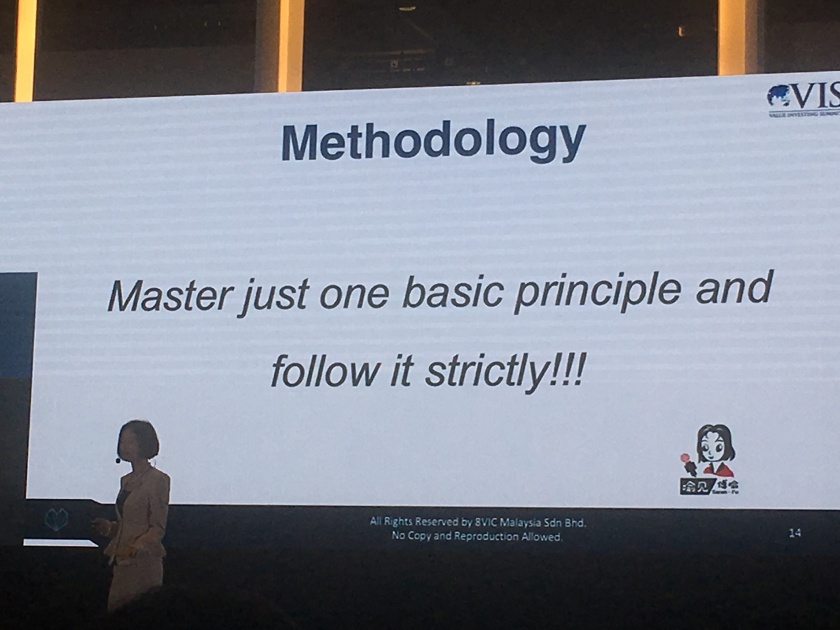
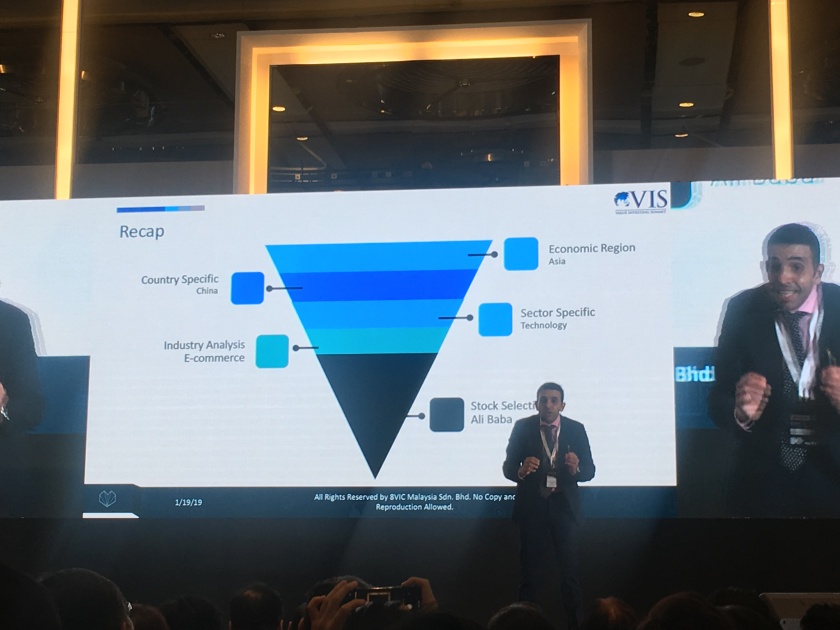
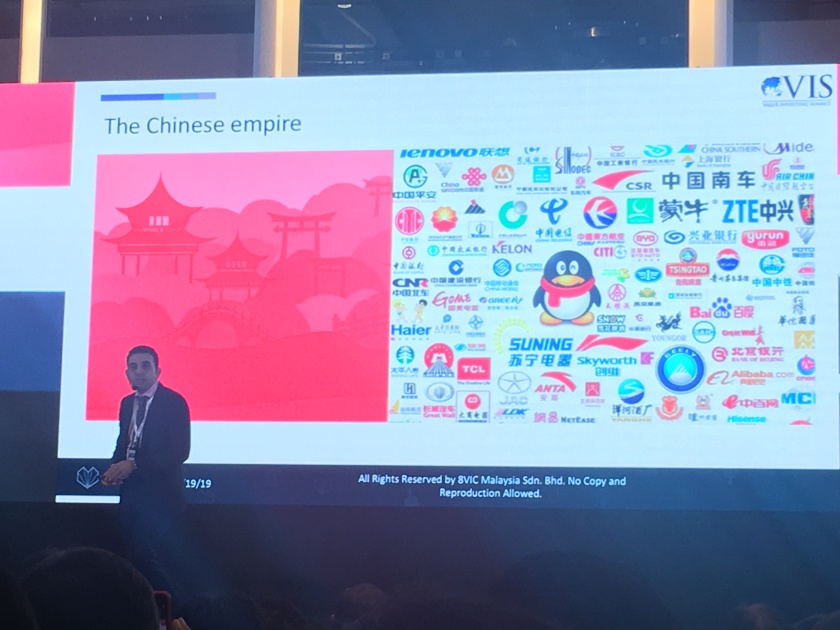
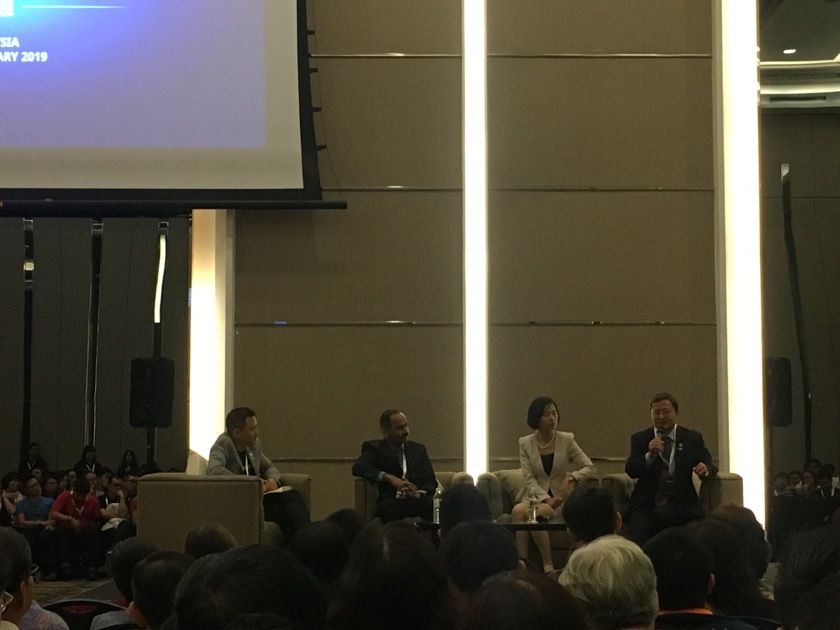
")
")
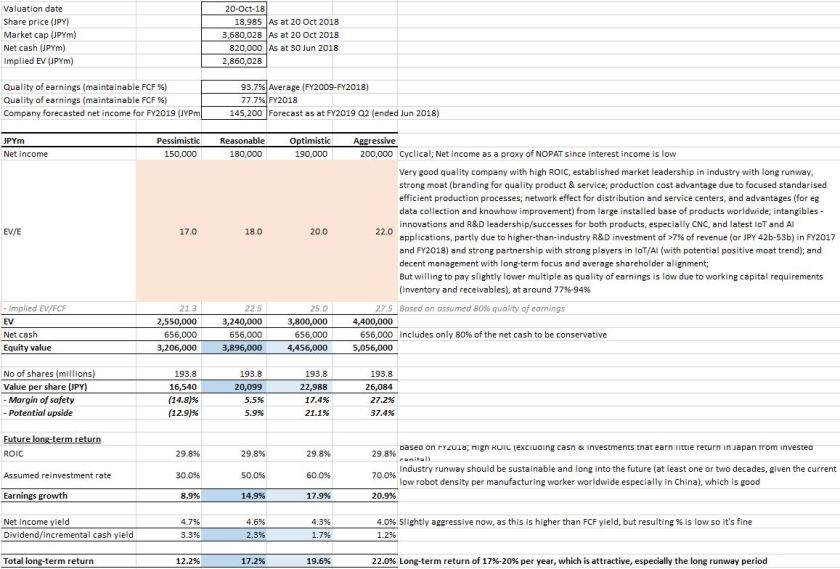

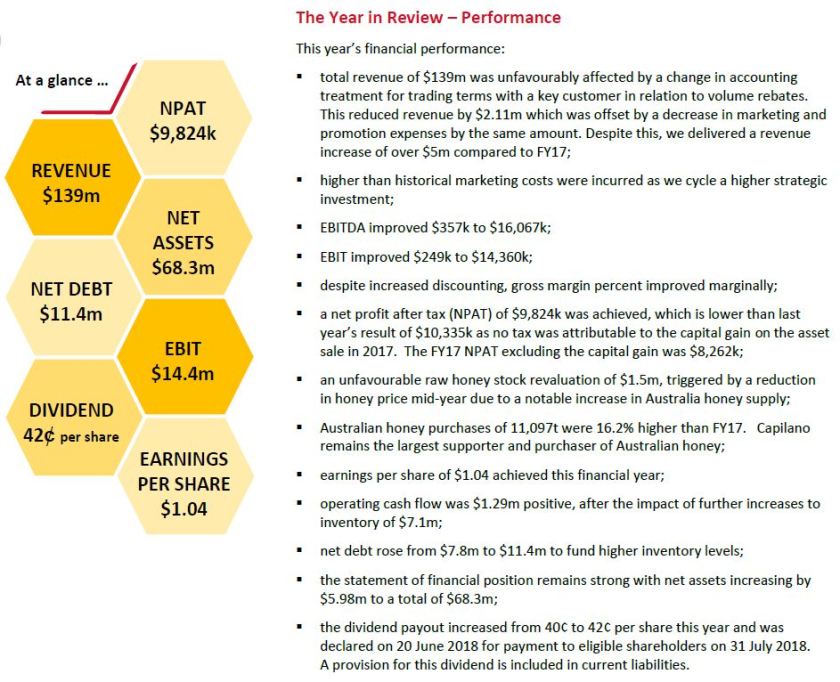
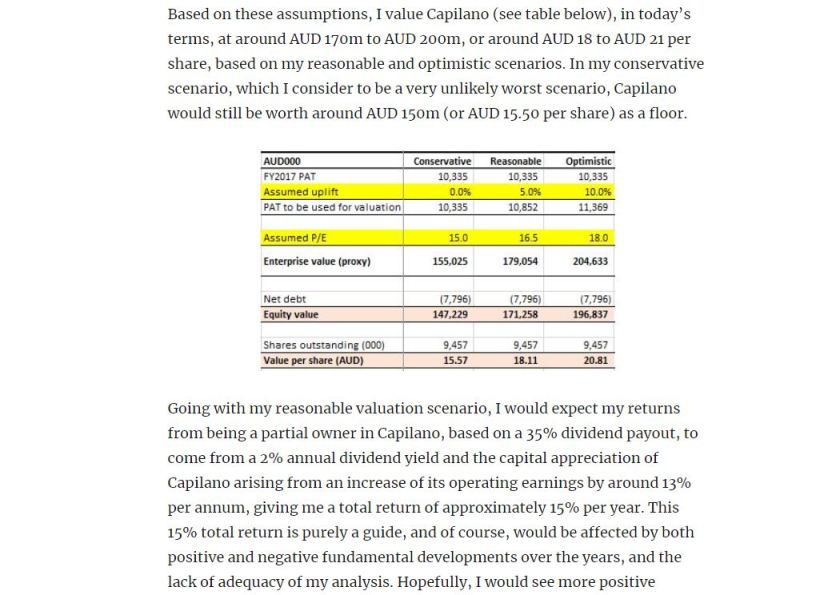
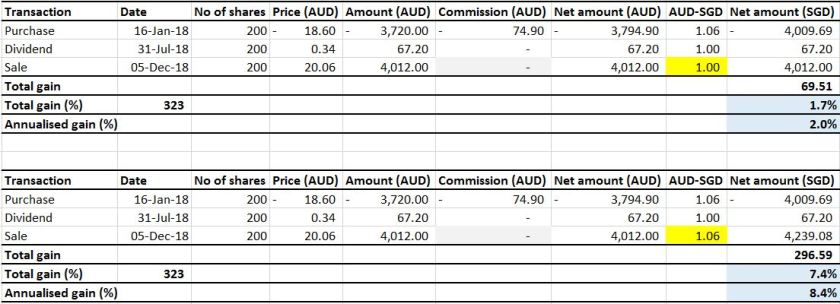

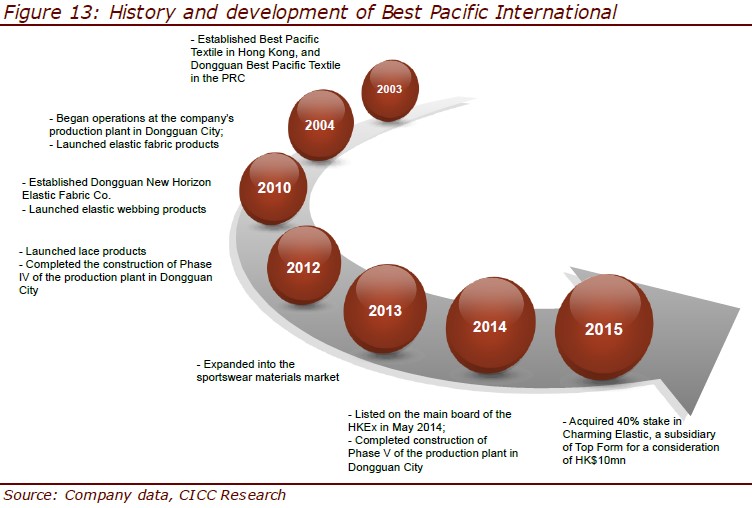
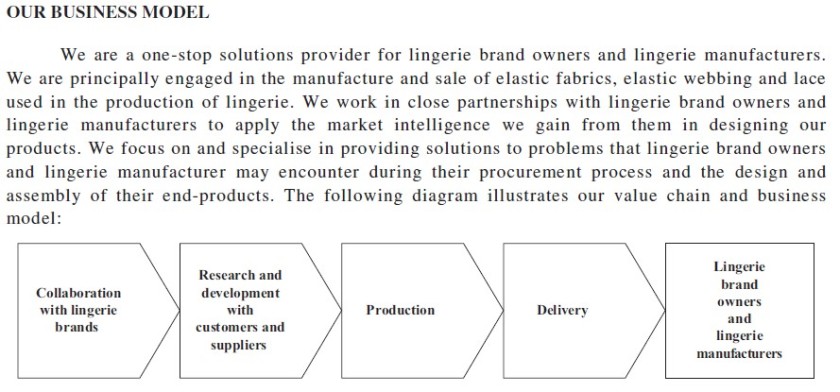
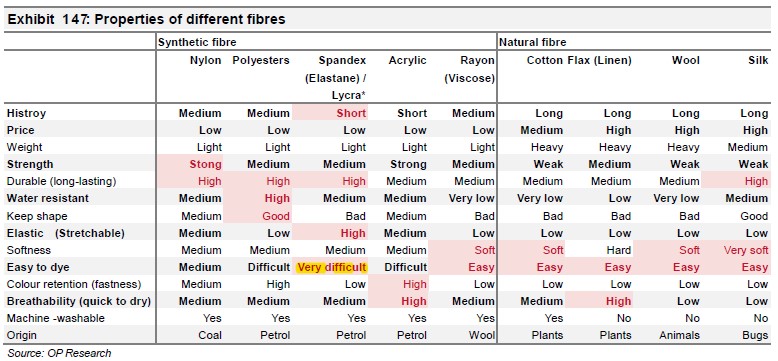
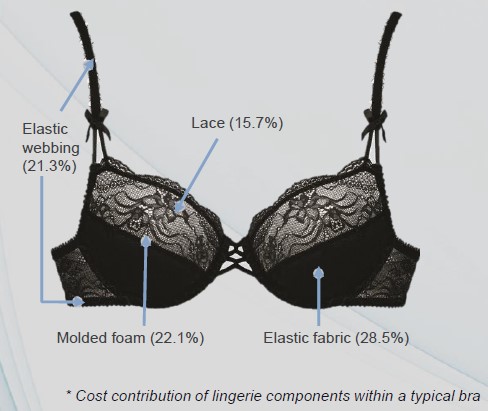
")
")
")
")
")
")
")
")
")
")
")
")
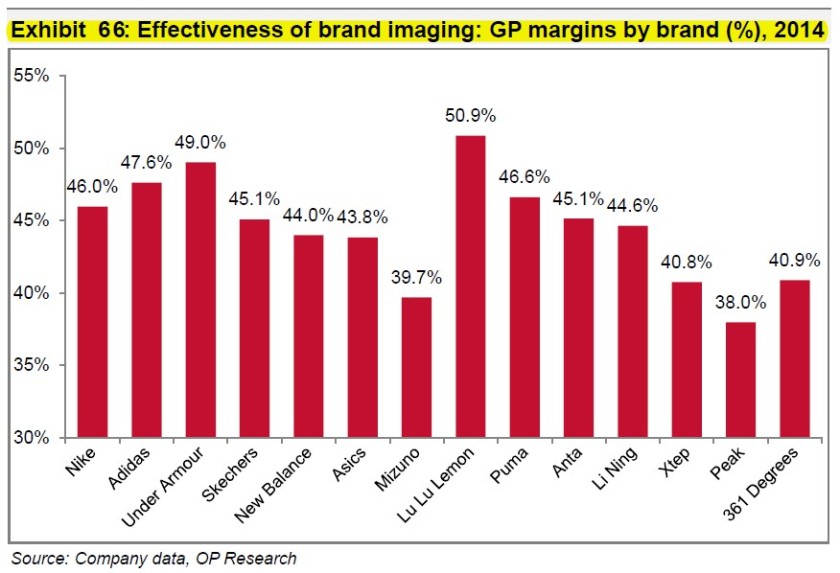
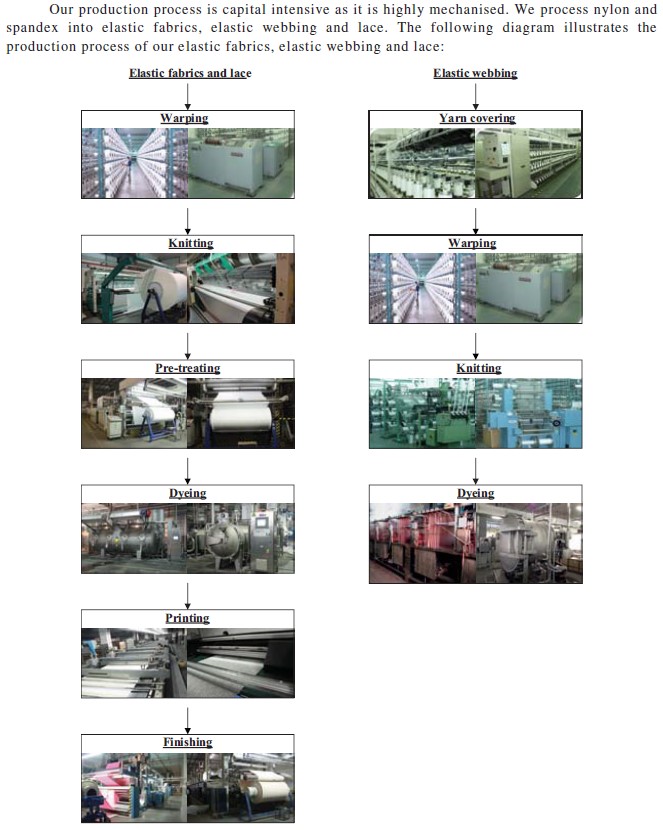
")
")
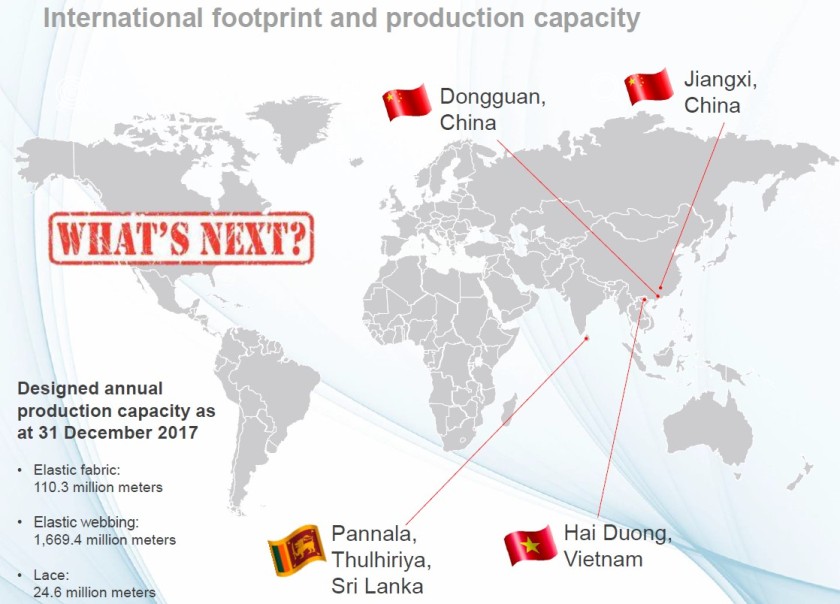
")
")
")
")
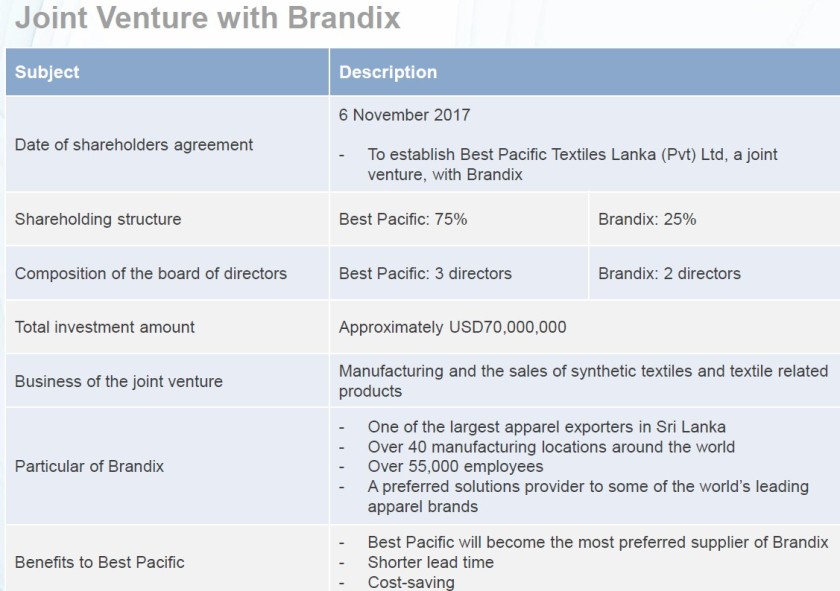
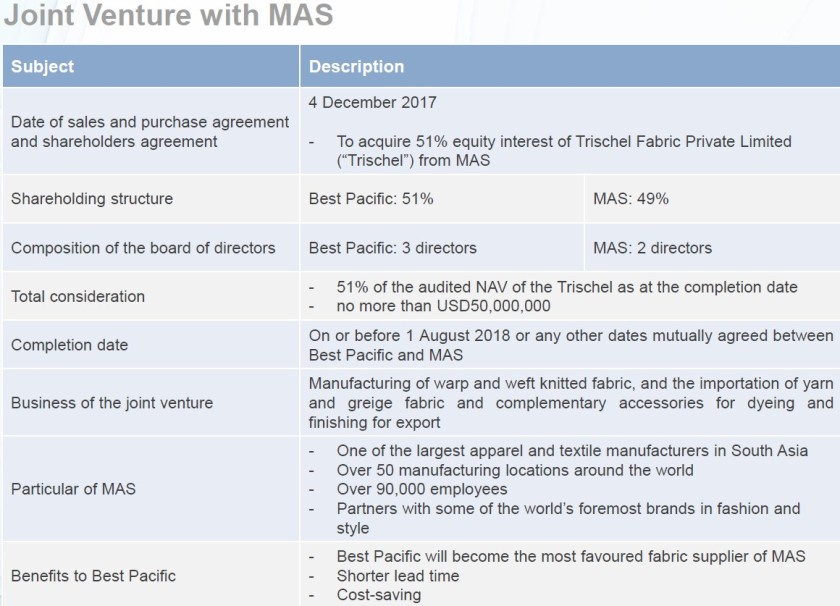
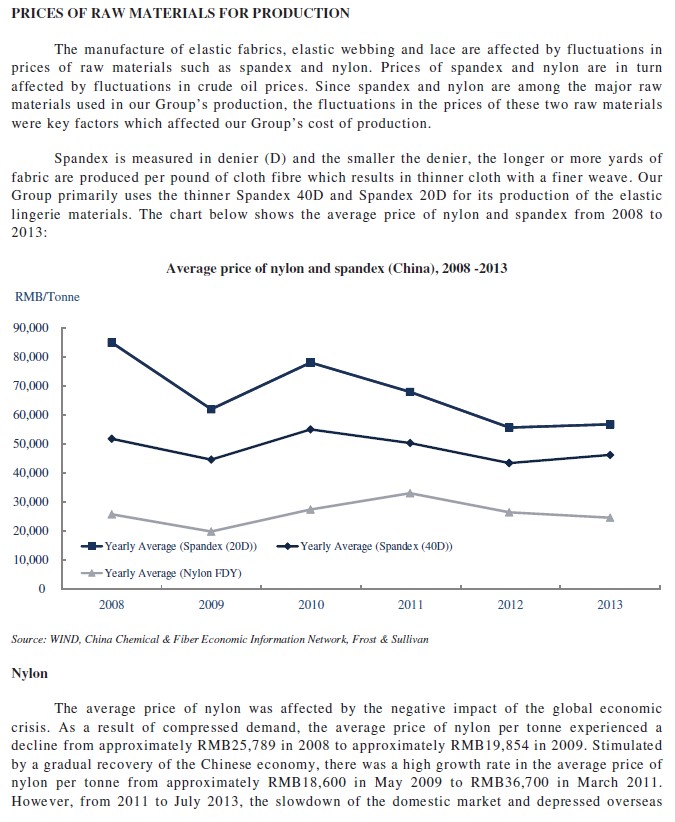

")
")
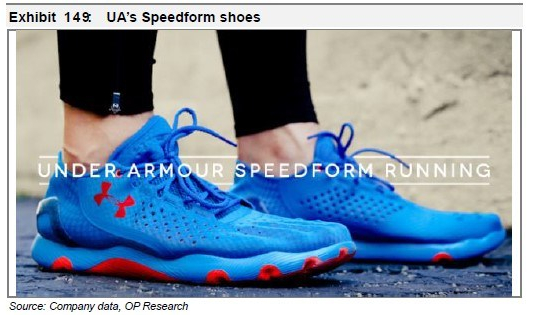
")
")

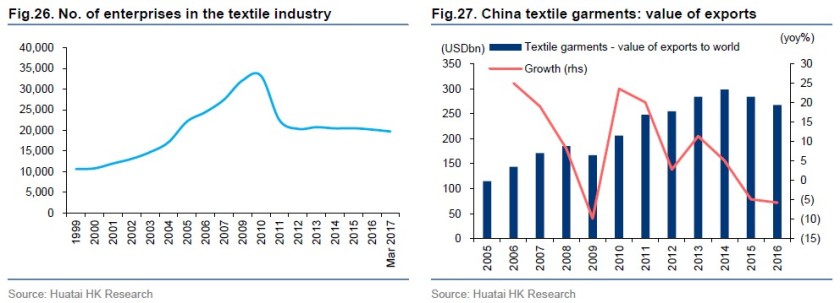
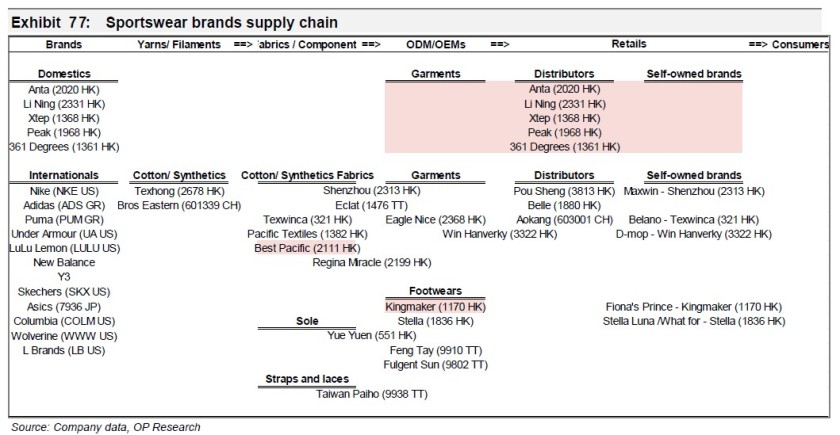
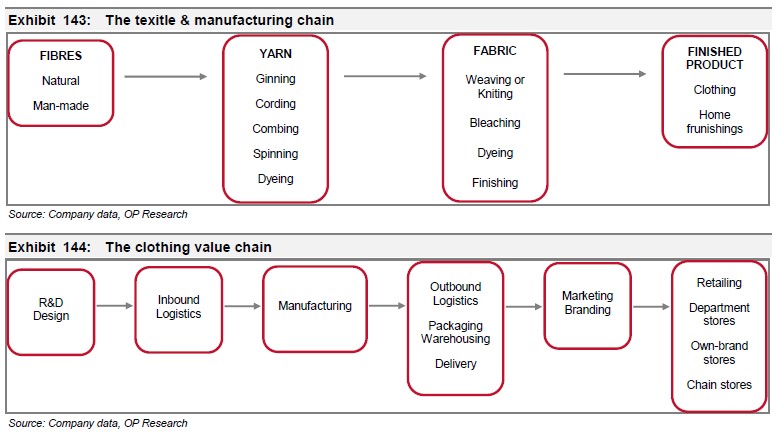
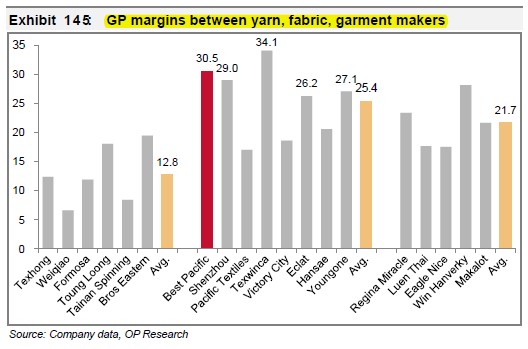
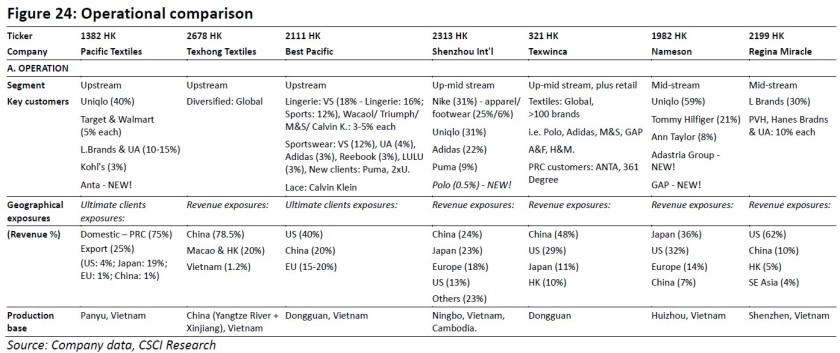
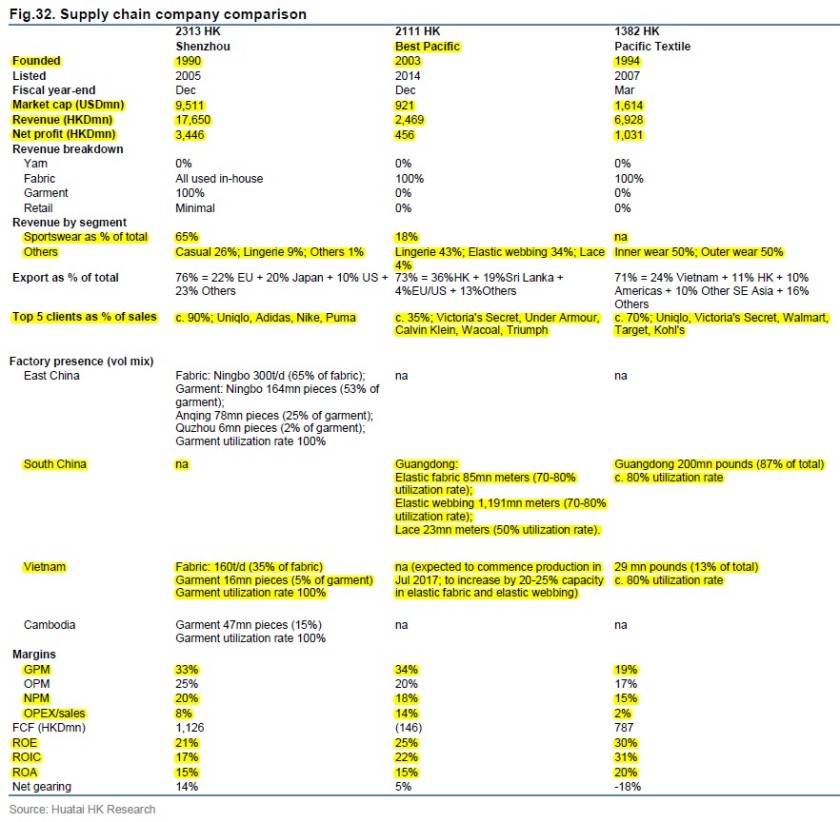
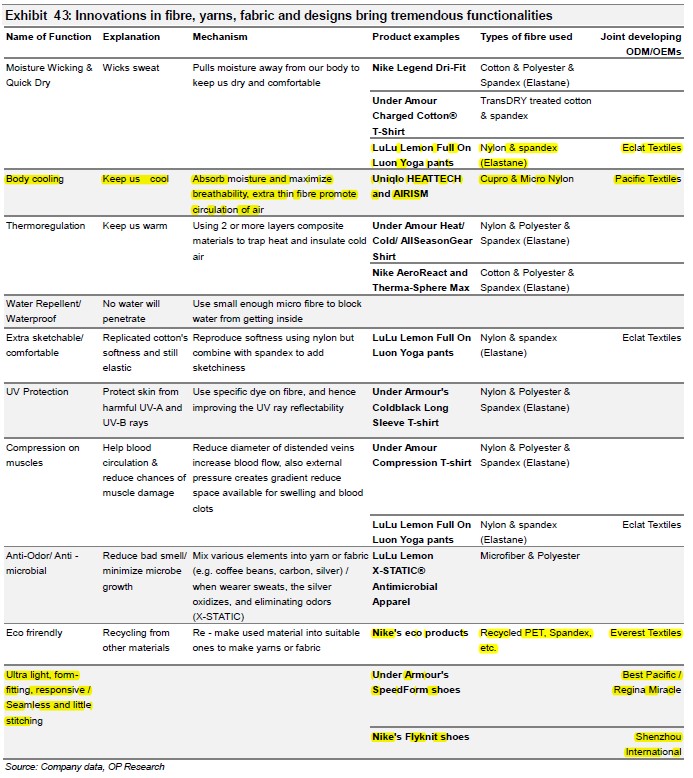
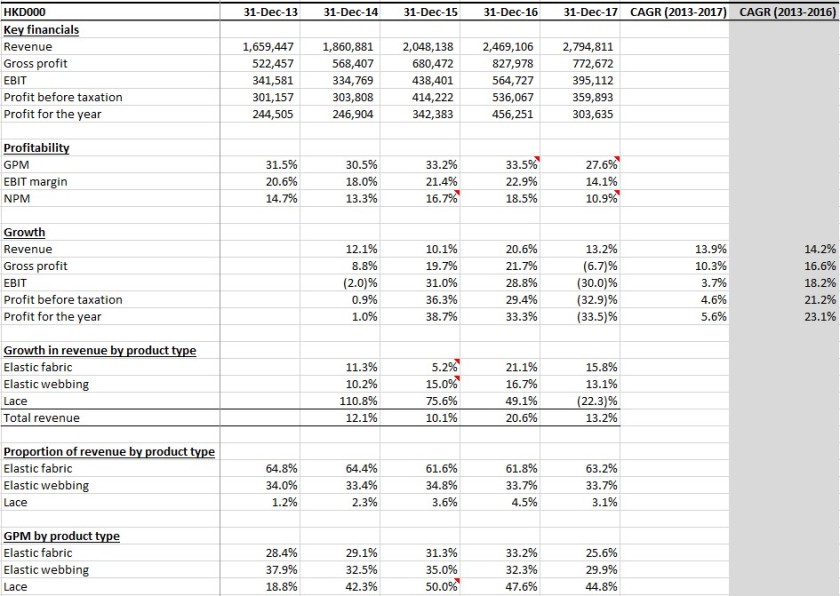
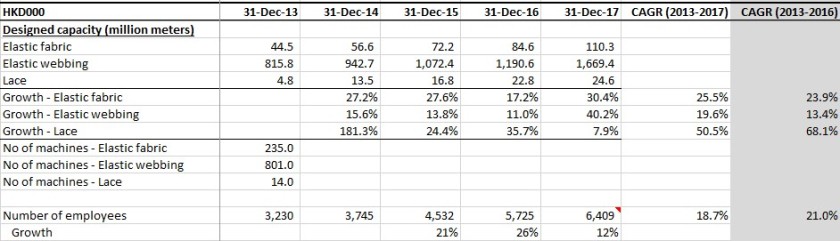
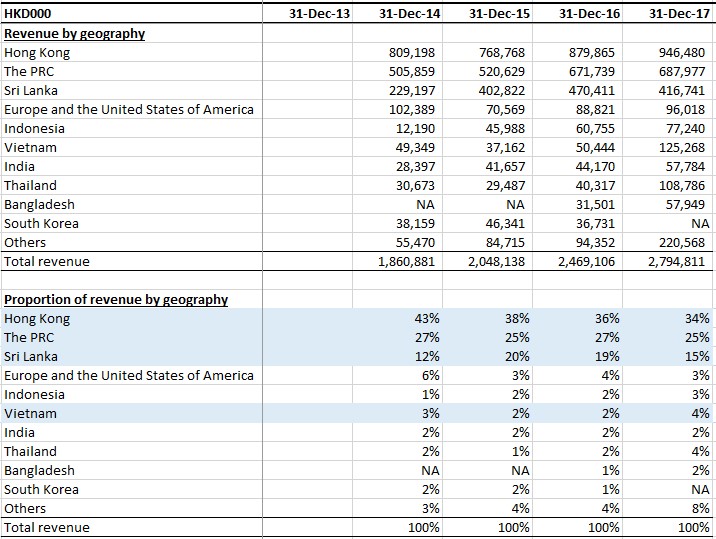
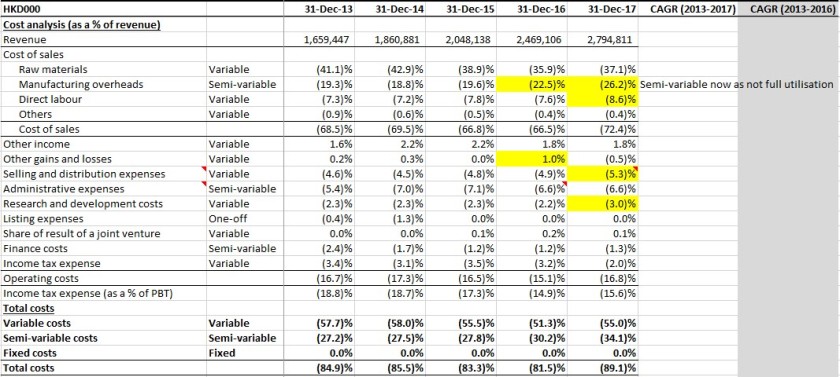
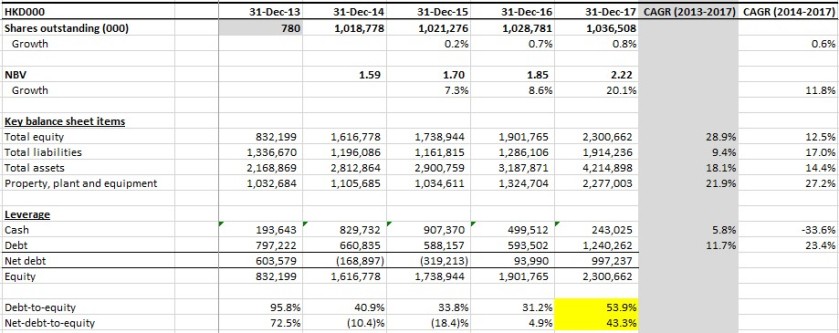
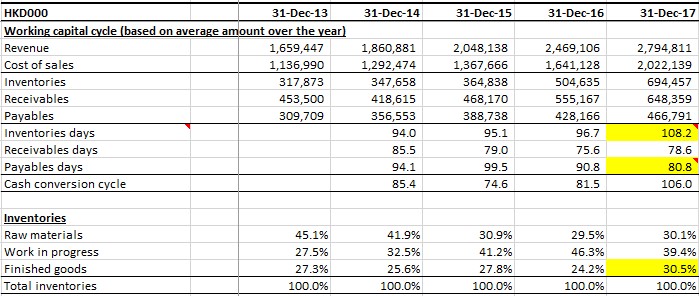
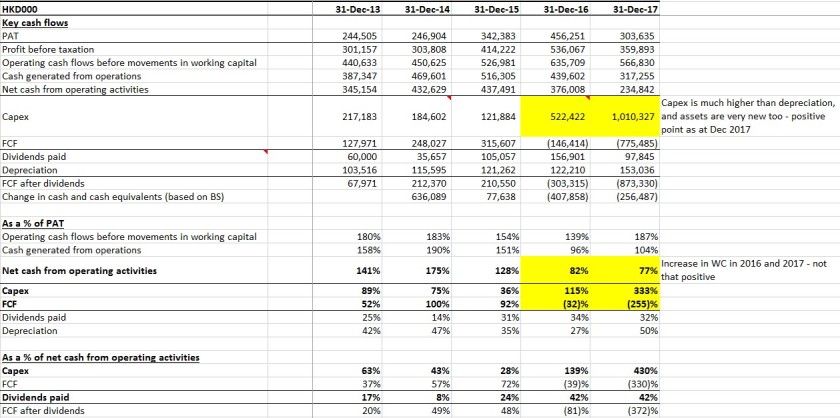
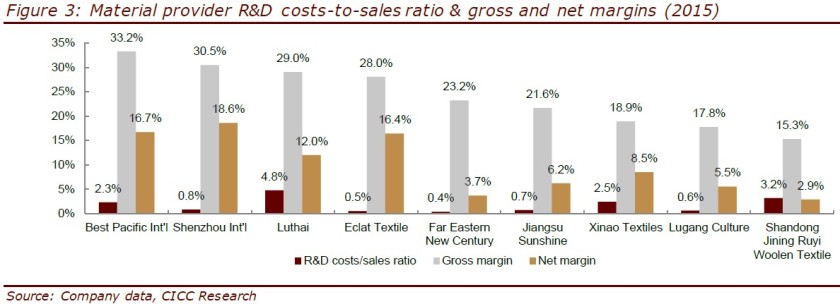
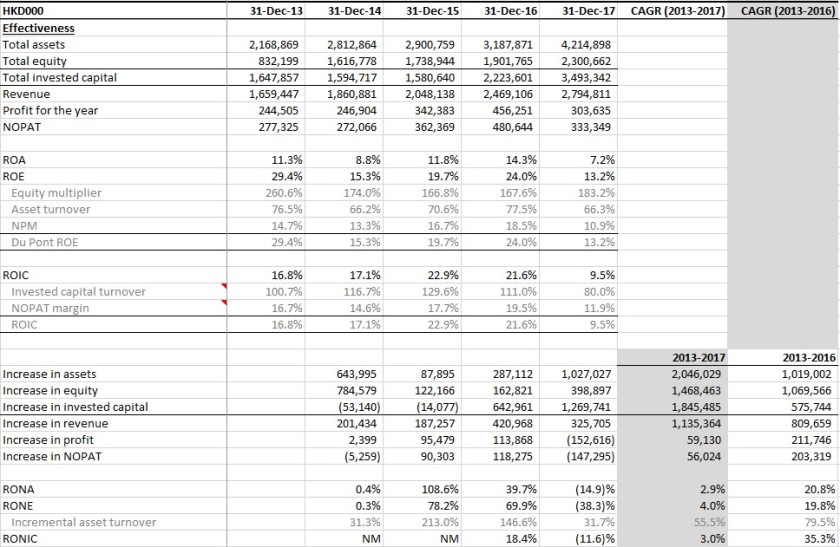
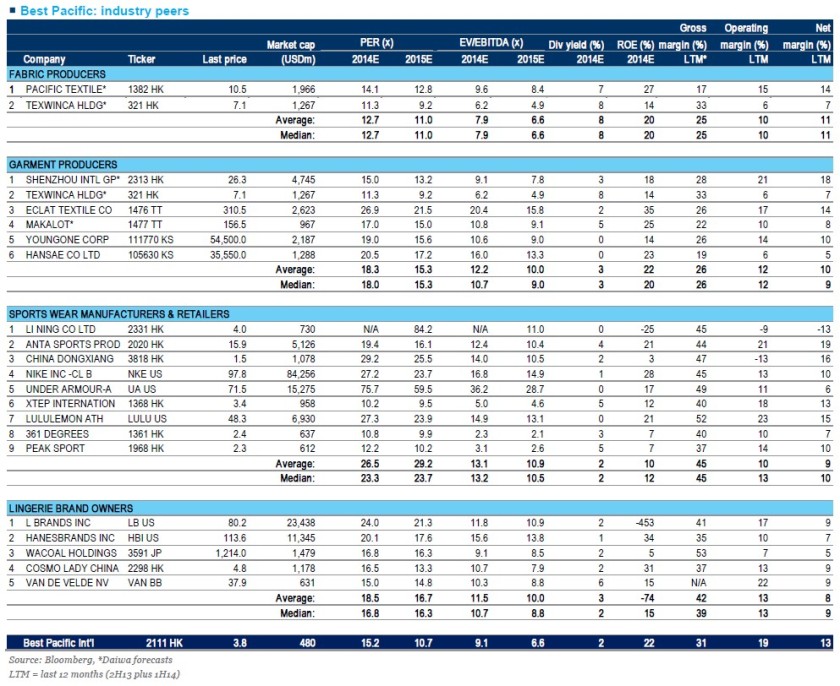
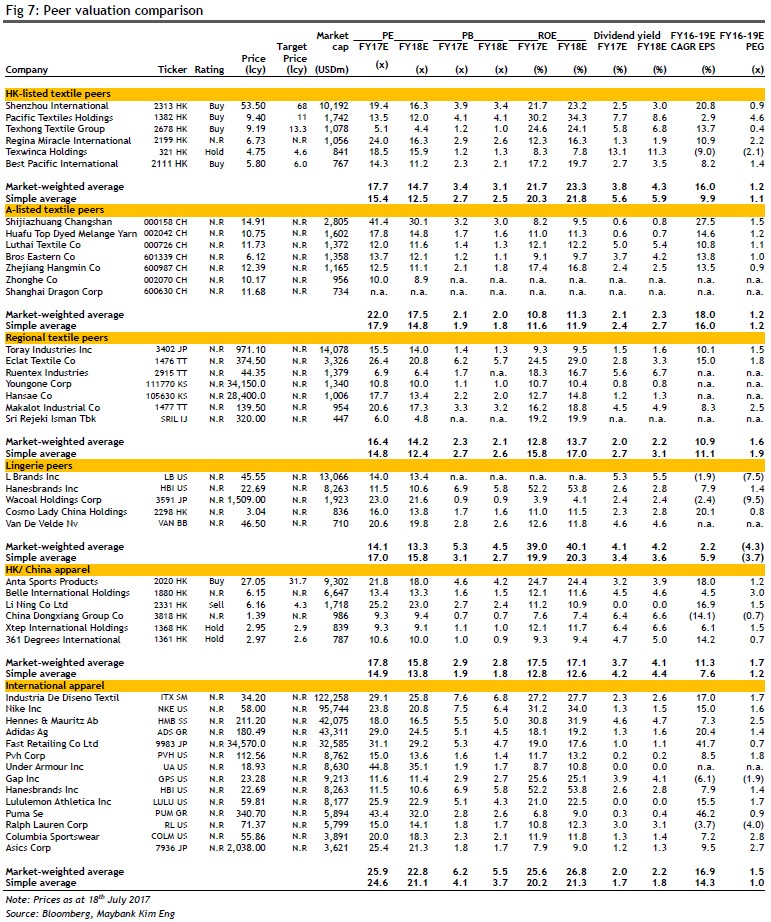
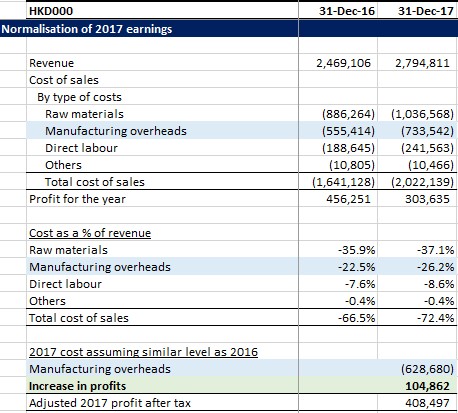
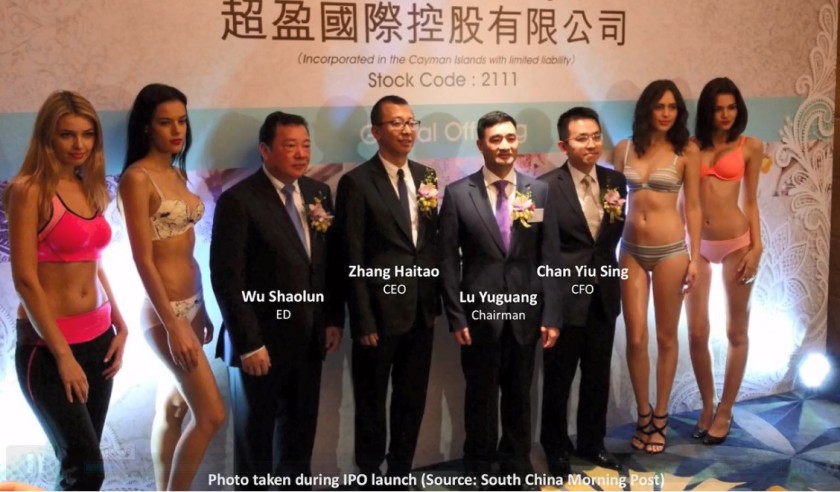
")
")
")
")
")
")
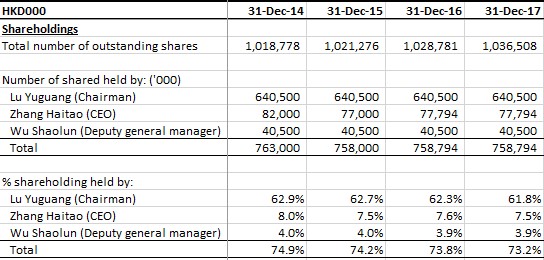
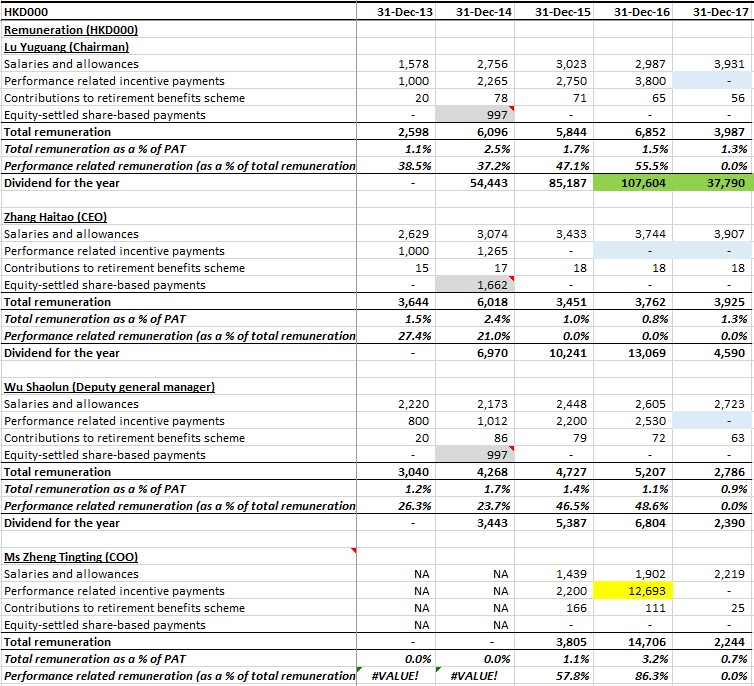
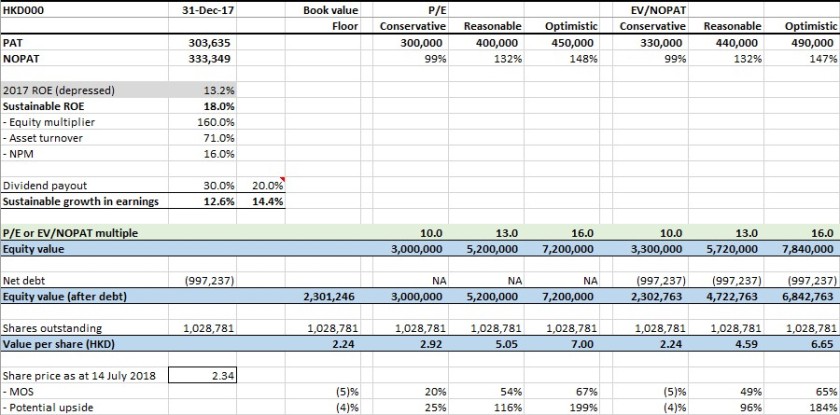
")
")