
Company name: Best Pacific International Holdings Ltd (“Best Pacific”)
Stock code: HKG: 2111
Market cap (as at 14 July 2018): HKD 2.4 billion
Average daily traded value: HKD 0.9 million
1. Executive summary
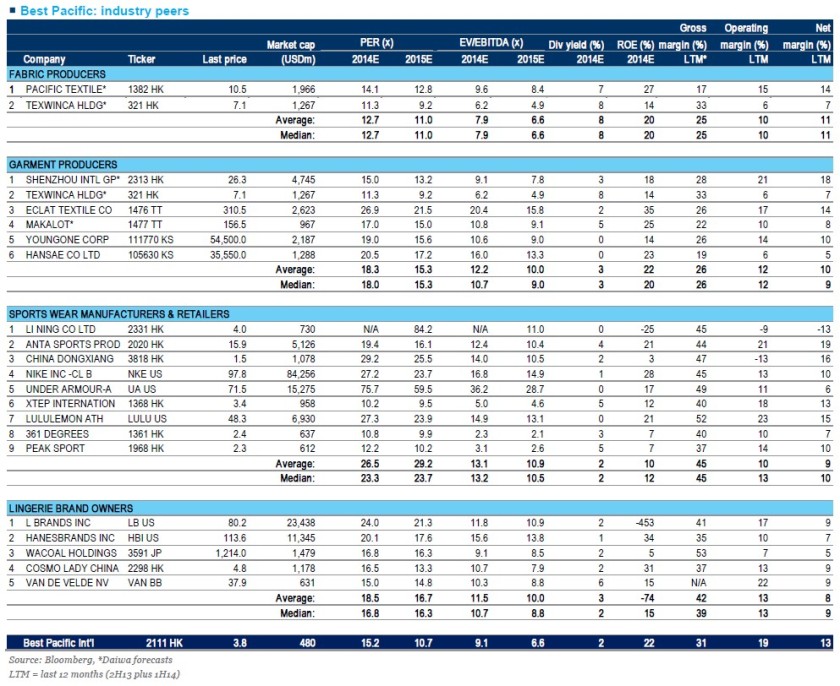
Best Pacific is a China-based textile manufacturer of high-performance lingerie and sportswear materials, with a focus on elastic fabric, elastic webbings and lace. It is the world largest lingerie materials manufacturer, supplying to renowned lingerie brands (e.g. Victoria’s Secret, Triumph, Wacoal, Maniform, Aimer, and Spanx) since 2003, and is increasingly expanding its sales to global sportswear brands (e.g. Under Armour, Lululemon, Adidas, Puma, 2XU and Sweaty Betty) since 2013.
Best Pacific fits my investment criteria – a good company with strong lasting moat (Criteria 1), high returns on capital (Criteria 2) and sufficient reinvestment opportunities (or growth runway) (Criteria 3); run by decent/good management (Criteria 4); and available at reasonable/attractive prices (Criteria 5) – and therefore constitutes one of my key holdings which I intend to hold for long (five years or more, as long as the fundamentals and my thesis remain intact).
The following sections set out:
- an introduction of the company;
- details and my views of the company, in terms of:
- its moat (criteria 1);
- its return on capital (criteria 2);
- its reinvestment opportunities (criteria 3);
- its management (criteria 4);
- the risks associated; and
- its valuation (criteria 5);
- some concluding thoughts.
2. Introduction
Overview
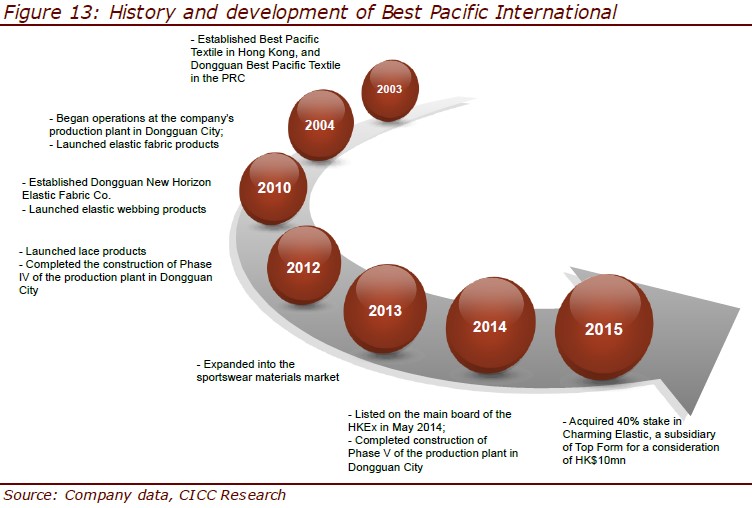
Best Pacific was founded in 2003 by two textile veteran, Mr Lu Yuguang 盧煜光 (current executive chairman) and Mr Kane Zhang Haitao 張海濤 (current CEO), and was listed on HKSE on 23 May 2014, raising around HKD 530m.
In 2004, it began its operations in Dongguan, China, manufacturing and selling elastic fabric products to lingerie players. Subsequently, it progressively expanded its operations, and six years later it started launching more product categories – elastic webbing products (2010) and lace products (2012), becoming a one-stop supplier of the major material components of a typical bra.
In 2013, leveraging on its expertise and knowledge in elastic materials (elastic fabric and webbing), it expanded into a new high-growth market – the sportswear materials market, and the management intends to grow this business segment to a size larger than that of lingerie.
History and development of Best Pacific
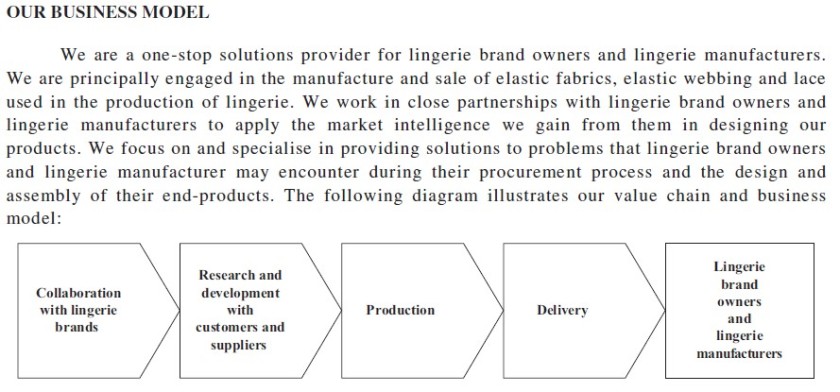
Business model
Best Pacific mainly engages in the manufacture and sales of elastic fabrics, elastic webbing and laces.
Unlike an ordinary OEM (original equipment manufacturer), it works in close partnerships with (i) the lingerie/ sportswear brand owners, (ii) the mid‑/ down-stream garment manufacturers and (iii) the raw material (fibre/ yarn) manufacturers, to apply the market intelligence it gains from them and its own R&D activities in designing its products. This R&D activity, innovation capability and close partnership with other stakeholders in the value chain differentiates Best Pacific from a normal OEM/ ODM (original design manufacturer).
Best Pacific’s value chain and business model
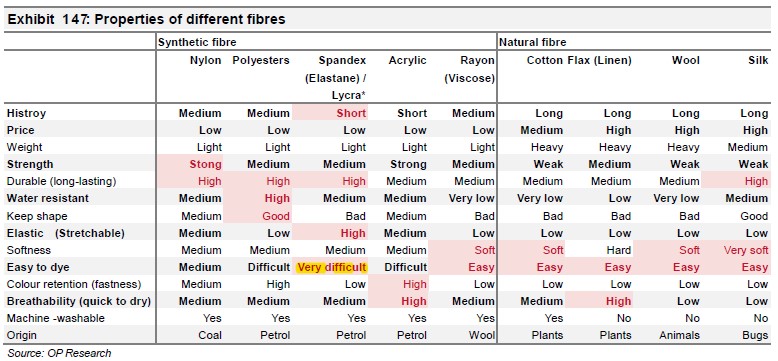
In addition, Best Pacific specialises in producing fabrics using synthetic fibres, in its case nylon and spandex (or also known as elastane globally outside of the U.S., or associated with Lycra which is a common type of spandex invented by DuPont), instead of natural fibres (e.g. cotton and wool). Synthetic fibres have certain advantages over natural fibres, for e.g. cheaper, lighter, more durable, have more strength, and offer more colours, textures and other properties (water resistant, quick to dry, super elastic, anti-bacteria, etc), and there has been increasing use of synthetic fibres (which have a shorter history) in the market. However, compared to natural fibres, they are much more difficult to dye, which is a key process in the production, and therefore requires a certain level of know-how and skills. Thus, contrary to the general impression of commodity-like textile manufacturers, Best Pacific competes not just on price, but also on technology, know-how, innovation and quality in the synthetic materials field.
Properties of different fibres
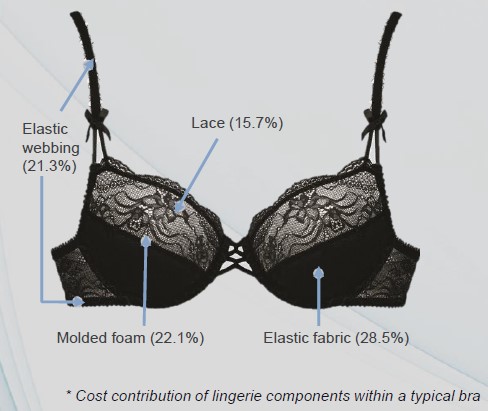
On the lingerie segment, a unique point about Best Pacific is that it is not only the largest lingerie materials provider in the world (more on market and competitors later), but also one of the few players that provide one‑stop solution for the three (of four) major components of a typical bra, in terms of cost – elastic fabric (29%), elastic webbing (21%) and lace (16%). It does not deal with molded foam (22%), but there has been increasing popularity of bralettes which do without molded cups, so for those products Best Pacific is able to supply almost all the components required.
Components of a typical bra
In terms of pricing, Best Pacific generally adopts a cost plus pricing model, which according to the company has enabled it to maintain a relatively stable gross profit margin.
So, in short, Best Pacific’s business model (which allows it to extract economic rents) is that:
- it procures textile raw materials and converts them into fabrics which it sells to garment manufacturers or brands, pricing them on a cost-plus basis (where possible) and therefore isolating itself from any changes in raw material costs;
- it adds value in the process of converting the materials into fabrics, where it utilises and leverages on its PPE base, know-how/skills/technology to understand the market requirements/trends and produce good quality fabrics and innovations (in terms of raw material innovation and end product innovation) that it has developed over years of R&D, market research and close partnership/relationship with its customers and suppliers. It also adds value on the lingerie segment in terms of being a one-stop supplier of the major components of materials, allowing for easier procurement, quality control and consistency and shorter lead time. These are the main value-adding aspects of Best Pacific, which allow it to earn decent/superior gross profits (ressulting in economic rents); and
- it imposes (financial and operational) discipline on itself to control/ minimise the operating costs of the business, for e.g. by controlling labour costs, adopting automation both in terms of production and warehousing inventory control, strategically locating its production facilities close to customers to reduce logistics cost and lead time, etc. In my view, this is a hygiene factor that Best Pacific has to achieve, which does not allow it to extract additional economic rent (since peers would do the same, and in fact can probably do better due to their larger sizes and greater customer concentration (resulting in less distribution costs) and earn above-average return on capital.
Operations
Best Pacific has the following visions and missions (based on its 2017 annual report):
- Vision: “Build on innovation and technology” has always been the Group’s vision in developing new products to meet the market demand. Through its dedication in research and development, the Group has developed a diversified portfolio of high-performance lingerie, sportswear and apparel materials, which are blended with quality, comfort and functionalities.
- Mission: While Best Pacific is expanding and diversifying the customer portfolio with its innovative products across the sectors, we also focus on delivering our social responsibilities and the Group has always aimed at creating a green, healthy and safe working environment, while at the same time educating and equipping our staff with the relevant skills and knowledge to manufacture safe and quality products. Best Pacific not only sees the mission as part of our high corporate governance and social responsibilities, but also considers it a crucial element for the long term sustainable development of the Group.
In terms of operations, Best Pacific has been based in Dongguan, China all the time, until it expanded into Vietnam (2016) and Sri Lanka (May 2018). As at the end of 2017, it has 6,409 full time employees – 91% (5,859) in China and 9% (550) mainly in Vietnam.
In terms of products, Best Pacific produces three product categories – elastic fabric, elastic webbing and lace.
Best Pacific’s products
")
")
Customers
Since its operations in 2004, Best Pacific has gradually secured several global renowned lingerie and sportswear brands and developed close relationships with them (which in my view goes to showing its quality products and strong capabilities).
Some examples of customer sign-ups include Triumph (2004), Marks & Spencer (2005), Victoria’s Secret (2007), Wacoal (2008), Under Armour (2012), LuluLemon (2013), Adidas (2013), 2XU (2016), Sweaty Betty (2016) and Uniqlo (2018 – tentative, as I have not been able to confirm this yet).
Currently, it has a broad customer base of over 300 customers (according to a 2017 report by Huatai Financial).
Best Pacific’s customers
")
")
")
However, Best Pacific has a few key customers that constituted a major portion of its sales, in particular Victoria’s Secret (around 25% for both lingerie (12%) and sportswear (12%)), Under Armour (4%), Calvin Klein, Marks & Spencers, Wacoal and Triumph; and is therefore exposed to the sales performance of those customers. This level of customer concentration, however, is low relative to a few of the other strong competitors/peers (e.g. Shenzhou International and Pacific Textile – more on competitors later) which can have ~70%-80% of sales concentrated in top 5 customers.
Details of Best Pacific’s customers
")
")
The images below provide a better idea of the type of end products sold by Best Pacific’s customers.
Products sold by Best Pacific’s customers
")
")
")
")
")
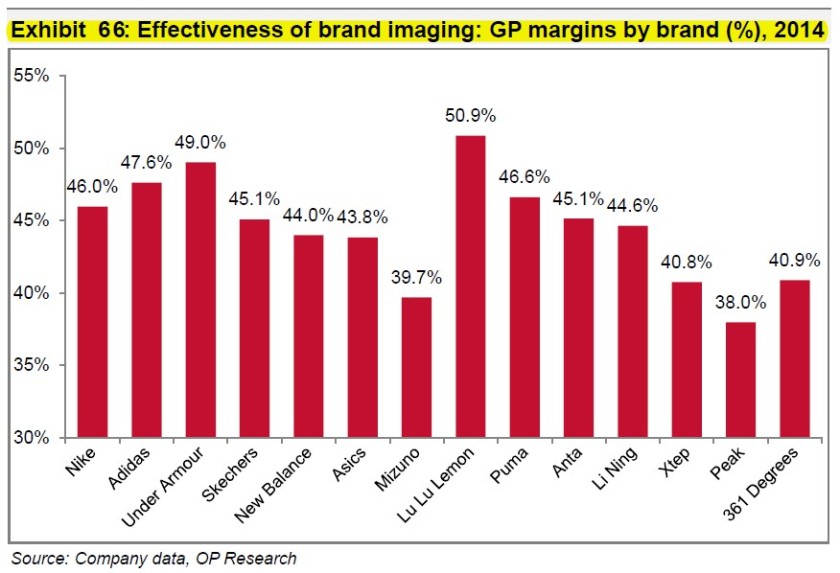
As seen in the figure below (based on 2014 financials), the sportswear brands that Best Pacific works with has relatively high gross profit margins (>45%), which are potential indicators of powerful brands with a certain level of pricing power.
GPM of sportswear brands (2014)
Assets & production
As at end 2017, Best Pacific had total assets of HKD 4,215 million (based on book value), with the majority being:
- PPE – HKD 2,277m (54%);
- Inventories – HKD 694m (16%);
- Receivables – HKD 648m (15%); and
- Cash and bank deposits – HKD 243m (6%).
The majority of its PPE (HKD 2,277m) was:
- machinery (HKD 1,309m or 58%);
- buildings (HKD 551m or 24%); and
- construction in progress (HKD 357m or 16%).
As seen in its asset base, Best Pacific is operating in a capital intensive environment, with more than half of its assets in PPE, of which around 60% of it is machinery. According to a Daiwa 2014 report, “Since the majority of the machines used by Best Pacific are state-of-the-art ones and are imported from Europe (Karl Mayer machines for elastic fabric and lace, Miller machines for lace), we expect machinery purchases to continue to take up the bulk of the Best Pacific’s capex budget.” The costs of these textile-producing machineries are not cheap (especially for lace). Based on data in the 2014 IPO prospectus, the (approximate) cost of one machine for:
- elastic fabric was HKD 0.39m;
- elastic webbing was HKD 0.23m; and
- lace was HKD 5.32m.
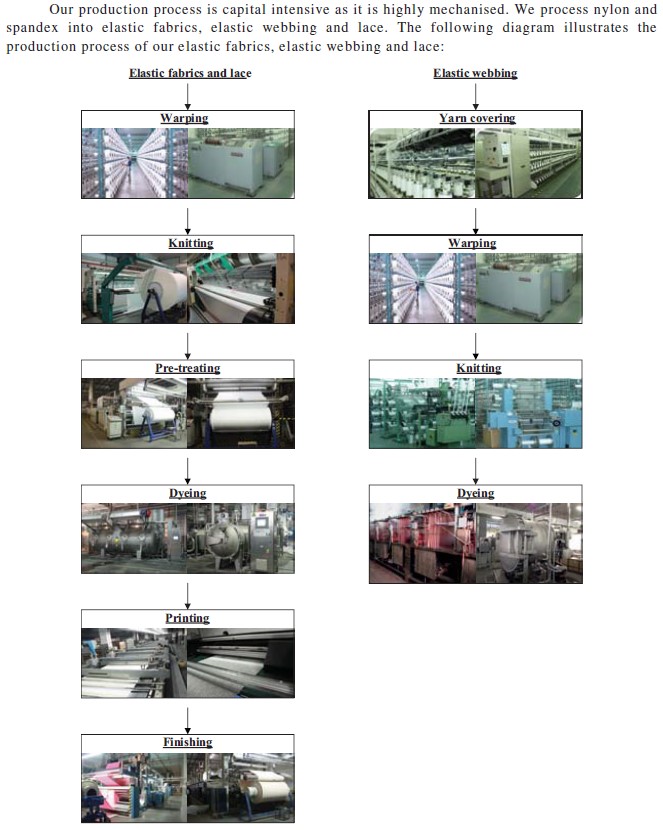
In terms of production, the production process is capital intensive as it is highly mechanised, where the company processes nylon and spande into elastic fabrics, elastic webbing and lace (as shown in the diagram below). The production time from raw material to finished elastic fabrics and lace is ~2-3 weeks and ~1 week for elastic webbing, while raw materials are generally prepared three months ahead.
Production process
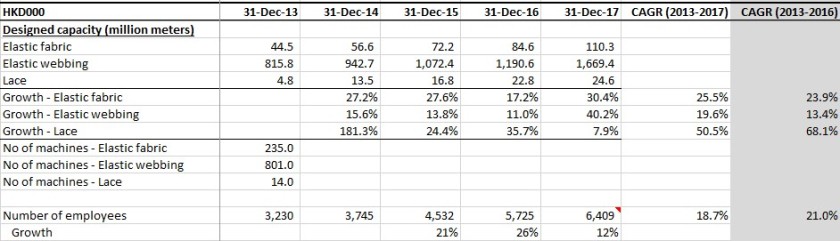
In terms of production facilities, the company has been increasing its capacity for all three product categories greatly over the last few years, more than doubling the capacity from 2013 to 2017 (i.e. a CAGR of 18% or more), partly due to increased capital from its IPO in 2014.
Best Pacific’s production capacity
")
")
International production footprint of Best Pacific
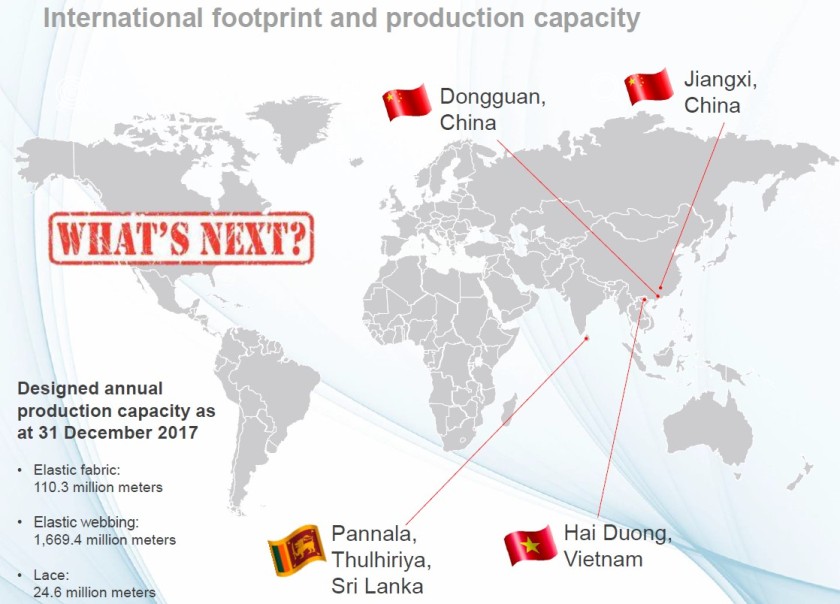
The diagram above depicts Best Pacific’s international production layout. Up until 2016, all of its production facilities were located in Donguan city in Guangdong province (and Jiangxi province) in China. On the Dongguan plant, China Securities International indicates in its January 2017 report that [emphasis mine]:
- “Dongguan plant is running at 24 hours a day, with high labour retention rate. There are a total of 3,000 workers in the Dongguan plant, with production running 24 hours a day on 3 shifts of around 8 hours each. The average monthly wage rate is c. RMB 4,000, which is higher than the industry average. Also, a dormitory is provided in Dongguan’s city centre. As such, the worker’s retention rate after the previous Chinese New Year holidays was over 90%”;
- “We are impressed by its high automation production process, making it nimble on capacity adjustment and least vulnerable to wage hike in China, which we believe will be one of its major competitive edges over a shortening order cycle”; and
- “At present, its warehouse is operated manually. BP is planning to upgrade it to full automation in 2017. This is expected to enhance its production efficiency and the estimated cost is RMB 100mn.”
In 2016/2017, the company started constructing its first plant in Vietnam, in the VSIP (Vietnam Singapore Industrial Park) in Hai Duong, with a total investment of around HKD 600m, increasing the production capacity for elastic fabric and webbing by ~25%-30% (compared to end 2015). The plant was completed in mid 2017, with the trial production started in July 2017 and the first batch of production conducted in 2017Q3. As at March 2018, there was over 500 staff (~9% of total workforce) employed in Vietnam and the company expected to hire up to 1,200 local workforce in the near future.
According to the company, the reasons for the expansion of production in Vietnam include to leverage on the beneficial tax incentives and the cost savings from lower labour costs and logistic costs, and to be located nearer to its customers (e.g. Regina Miracle (IDM for Victoria’s Secret) and many other brands/garment manufacturers which have been moving their production from China to other countries like Vietnam since early 2010s (mainly in the wake of relatively higher labour costs in China).
Details of Best Pacific’s Vietnam plant
")
")
")
")
According to a CSI 2017 report, “BP is expected to derive cost savings from logistics (it no longer needs to ship its products to its customers in Vietnam), and lower labour and operating costs (which is 40% lower than PRC).”
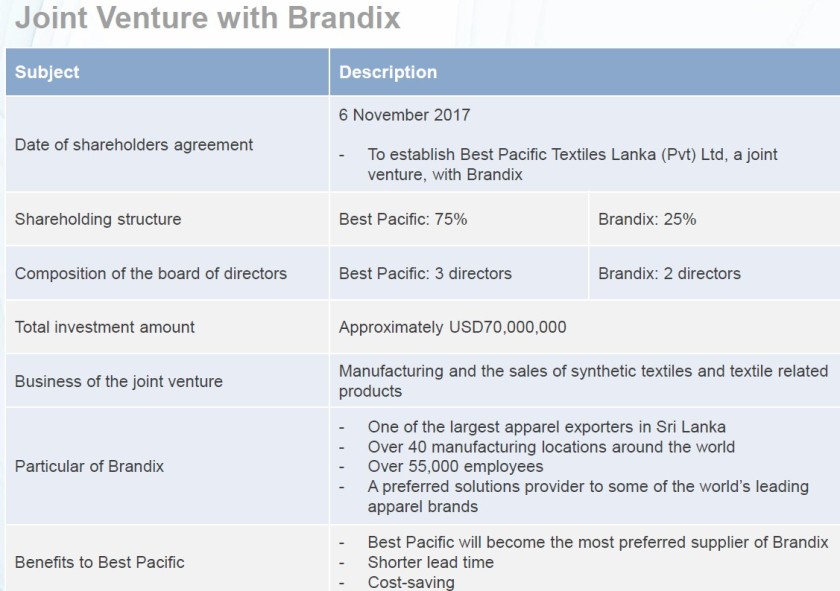
Recently, in May 2018, Best Pacific also started a joint venture with Brandix (Sri Lanka’s largest end-to-end apparel solutions provider (with 55k employees vs Shenzhou’s 75k) and an existing long-term major customer of Best Pacific (with overlapping customer base, e.g. Victoria’s Secret and M&S, and other customers like GAP and A&F)) in Sri Lanka, Best Pacific Textiles Lanka (“BPTL”), to manufacture and sell synthetic textiles and textile related products.
The total capital contribution into BPTL would be USD 70m (or, less likely, USD 50m, based on a different source) from Best Pacific (75%) and Brandix (25%), with some in-kind asset contribution (including main factory building structure and store building structure) of USD 1.5m from Brandix. The JV will be managed primarily by Best Pacific and will produce fabrics (with a specific focus on warp knit synthetic fabric) and supply to Brandix, and Best Pacific would become the most preferred supplier.
According to a DBS June 2018 report, the joint venture would require a new plant and construction should finish by the end of FY18F, which would form a substantial part of Best Pacific’s capex for the year.
Details on Best Pacific’s joint venture with Brandix
A bit more about Brandix – It also has partnership with Pacific Textile (Best Pacific’s competitor) for a very long time since 2004, through a joint venture called Teejay Lankan Plc, which was listed in 2011 on the Colombo Stock Exchange and focuses on knitted fabrics for the intimate apparel and sportswear industries, with its largest clients being Victoria’s Secret, Marks & Spencer and Intimissimi. This joint venture was more of a cotton fabric producer, instead of synthetic, but has entered into the synthetic fiber segment (due to good growth and demand, and to be a comprehensive one-stop supplier) in 2017 (with acquisitions of companies with such manufacturing facility). However, the focus of the synthetic category is polyamite, different from Best Pacific’s nylon and spandex, so I see it as a different and indirect competition. In my opinion, it might be that Brandix does not have the experience/ capability to manufacture the right type of synthetic fiber, including in this JV with Pacific Textile (allthough I am not entirely sure now). Thus, it had to, or it chose to, partner with Best Pacific recently to go into the synthetic nylon and spandex categories. The fact that it chose Best Pacific, and not Pacific Textile or others, was a positive point to me.
In addition, on 4 December 2017, Best Pacific also entered into a joint venture agreement with MAS Capital (a direct wholly-owned subsidiary of MAS, which is a current major customer of Best Pacific with long-term business relationships, and a reputable leader in the industry of apparel and textile manufacturing with mature international operation systems) in relation to the acquisition of 51% of the total issued share capital of Trischel Fabric (Private) Limited from MAS Capital.
According to the 2017 annual report, “Pursuant to the MAS JV Agreement, the consideration for the acquisition shall equal to 51% of the net asset value of Trischel as at the completion date and, in any event, shall be no more than US$50,000,000. Pursuant to the MAS JV Agreement, the completion of the acquisition shall take place on or before 1 August 2018 or any other date as BPSL (Thulhiriya) and MAS Capital may agree in writing. After completion, Trischel will continue its existing businesses including, among others, the manufacture of warp and weft knitted fabric, and the importation of yarn and greige fabric and complementary accessories for dyeing and finishing for export. Up to the date of this annual report [around 20 March 2018], completion has not yet taken place and Trischel is still owned as to 100% by MAS Capital.”
Details on Best Pacific’s joint venture with MAS
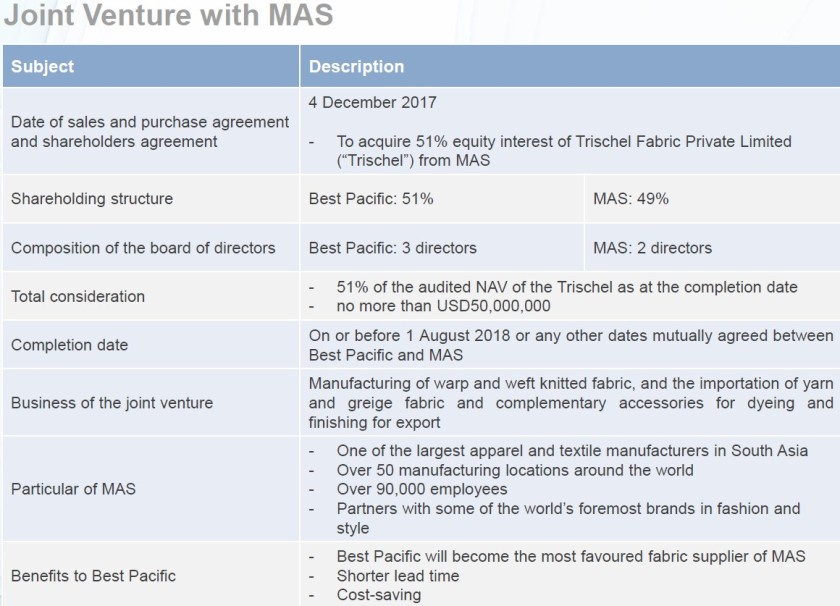
According to a DBS June 2018 report, “BP should takeover the MAS JV in 2H17, which is an existing operating plant. BP has already deployed staff for this operation and minor profit contribution is likely within FY18F. The Brandix JV requires a new plant and construction should finish by the end of FY18F. The majority of BP’s capital expenditure in FY18F would be associated with this expansion.”
A bit more about MAS – It also owns (unclear ownership %) Stretchline Holdings, the largest lingerie elastic webbing maker (5.1% market share in global elastic webbing in 2012, versus Best Pacific’s 3.9%) based on a Frost & Sullivan research. Based on Stretchline’s website, it is the world largest and only branded narrow fabric manufacturer, with many (patented) innovations (LockSafe, Fit-J, BondeLast, Stay4Sure and Fortitube technologies, which are lock-knit, narrow fabric, silicone coating, or puncture resistant fabric wirecasing technologies).
Materials & suppliers
The primary raw materials that Best Pacific uses in its production are nylon and spandex (around 70% of all raw materials based on a Daiwa 2014 report). The company also sources dyes from the suppliers. The cost of raw materials form a large part of the company’s cost of sales, at around 50%-60% in the past five years (2013-2017). It purchases these raw materials mainly from suppliers in China, Taiwan, Hong Kong and other overseas countries, which are manufacturers and sourcing agents of nylon and spandex.
Based on the 2014 IPO prospectus, the company has had business relationships with its five largest suppliers (which constituted around half of its total purchases, which has seen come down to 36% in 2017) for long periods, ranging from four to 10 years. Based on a Daiwa 2014 report, the company’s main suppliers include:
- Korea-based Hyosung (004800 KS) – Best Pacific partnered with Hyosung to launch a new range of fabrics with MIPAN Aqua X and creora Fresh (with moisture management, UV protection, comfort, fit and freshness from odour neutralising technologies) at ISPO Munich in February 2017;
- Japan-based Asahi Kasei (3407 JP); and
- Japan-based Toray Industries (3402 JP) – which has become a substantial shareholder of Pacific Textile in early 2018, the closest competitor of Best Pacific.
Based on my own research, I have also identified working relationships between Best Pacific and other suppliers, i.e.:
- US-based Eastman Chemical Company (NYSE: EMN) – Best Pacific produces Naia-based fabrics which are hypoallergenic, breathable, have a silky luxurious drape and hand-feel, and have good printing properties; and
- US-based Invista – Best Pacific has worked with Invista since its mill’s inception in 2003 and launched one of the first lines of commercially available Lycra Sport Power-Comfort-Energy (PCE) index-certified fabrics in mid 2017.
The prices of Best Pacific’s raw materials are affected by the prices of spandex and nylon, which are in turn affected by fluctuations in crude oil prices and the supply-demand economics in the market (e.g. economic crisis leading to lower demand and therefore lower prices, and oversupply in certain markets at certain times leading to lower prices). The chart below provides some idea of the prices of nylon and spandex in China, albeit for an outdated period.
Average price of nylon and spandex in China, 2008-2013
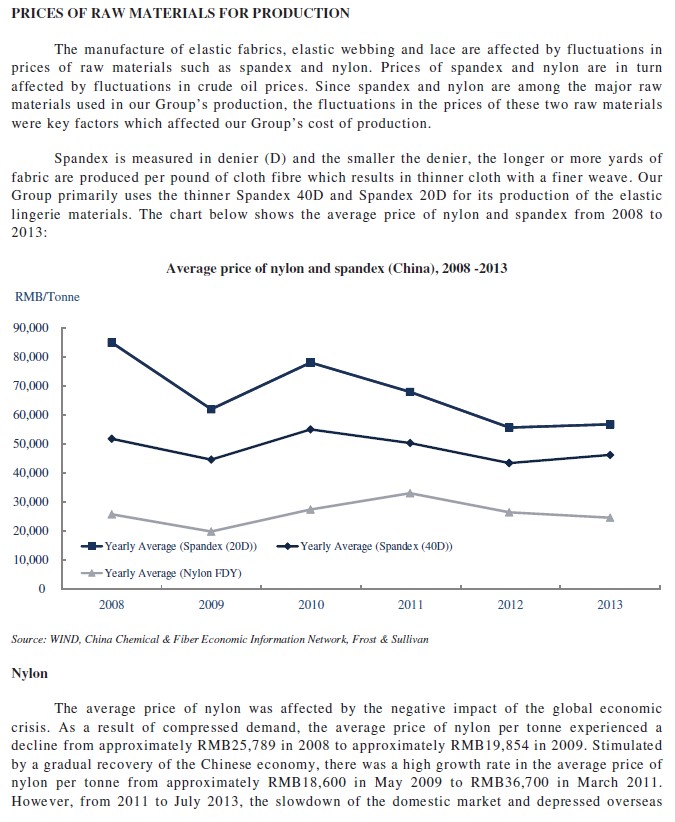
In my view, Best Pacific is exposed to the fluctuations of raw material prices to a minimal extent only, because:
- it sets its product prices on a cost-plus basis, so as long as it is value-adding (from its R&D and innovation and the quality of its products) and as long as the brands (of which most of them have quite high gross margins and branding/pricing power) or garment manufacturers are not facing tremendous headwinds, it should be able to pass on most (if not all) of the increase in raw material prices; and
- according to a CICC 2016 report, “Prices of raw materials (spandex and nylon) are influenced by oil prices, while yarn providers hedge the fluctuations. The ASP has been less volatile vs. raw material prices in the past. Judging from historical financial results, the company’s sales have shown steady growth and do not fluctuate together with raw-material prices.”
This, in my view, is supported or evidenced by the company’s relatively stable and high gross margins in the past few years (2017 GPM was affected by other factors – more on the financials later), although these are historical records which do not guarantee that Best Pacific can continue to produce innovative and quality products to justify the price premium of its products.
Best Pacific’s gross profit margins

R&D & innovations
R&D is a big part of Best Pacific, in line with its core value of “Build on innovation and technology”. Historically, it has been spending around 2%-3% of its revenue, or HKD 38m (in 2013) to HKD 80m (2017) a year , on R&D activities.
For example, the 2017 annual report states “The Group is dedicated to catering to the changing market preferences by introducing innovative lingerie, apparel and sportswear materials. For the years ended 31 December 2016 and 2017, the Group’s research and development costs represented approximately 2.2% and 3.0% of its total revenue, respectively.”
In terms of R&D, the 2014 IPO prospectus states that “Apart from maintaining close relationships with lingerie brand owners to develop new lingerie materials, we also work closely with out major raw material suppliers, who are leading players in the nylon and spandex industries, to jointly develop new fabrics or materials in response to the evolving market demands. When a new material is jointly developed by us and the supplier, we may request the supplier to enter into exclusively arrangements with us for the supply of the jointly developed material, allowing us to capture the market demands for such new material on an exclusive basis and increase our market share in the global lingerie materials market. The costs associated with our collaborations with our suppliers on research and development are generally shared between us and the suppliers.” [emphasis mine] The company also has a design studio in Qingdao City in order to capture local talents and innovation since 2012.
As at the end of 2013, the R&D team consisted of 91 personnel who are led by Mr. Shi Jiangzhi 石蒋志, a member of the senior management team who has been an employee of the company for ~10 years then, and the company had registered for 30 patents in China which are material in relation to its business.
Three years later, as at the end of 2016, the R&D team has grown slightly to more than 100 personnel (based on a CICC December 2016 report) and the number of patents has at least doubled to more than 60, being a mix of design patents and fabric patents (as at December 2015, based on a Oriental Patron 2015 report). The R&D team is split into two teams, one working closely with the major raw material suppliers, who are leading players in the nylon and spandex (Elastane) industries to develop new fabrics and material, and another team focusing on other research and lingerie product designs. In terms of design, I have only come across data for 2013, where the company generated about a substantial 200 new designs in 2013.
Best Pacific’s R&D facilties
")
")
In addition, the company:
- works closely with a French fashion consulting firm (since May 2012) to assist in design and advise on trends, colors, and choice of threads and materials for elastic fabrics, elastic webbing and lace products;
- has also opened a School of Management and Administration in June 2016, “which aims to provide generic management training to employees of different managerial level, the first leadership and management training programme was launched during the year and external consultants have been engaged to give lectures to the relevant employees once a month since August 2016”; and
- has also established a Institute of Technology and Research in June 2016, and during the year, “the Institute engaged external professionals in the textile sector to provide a series of lectures to employees of different positions. The lectures aimed to introduce updated garment design concepts, manufacturing techniques and other industry specific knowledge to the relevant employees, so as to strengthen their knowledge of textile technology and to provide them with updates on the innovation and trends of the textile and garment industry. There were a total of 60 employees from the design team, research and development team, sales team and production department attending the lectures.”
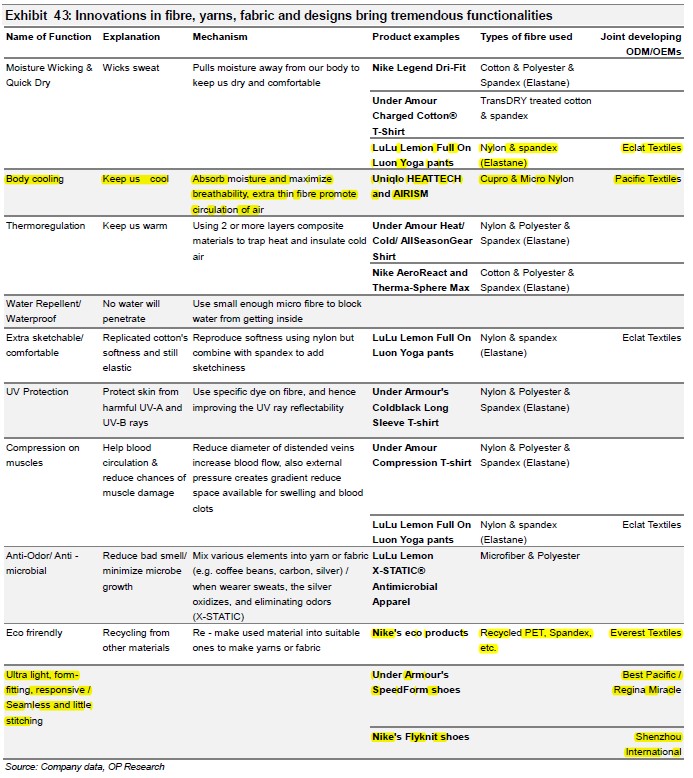
The company’s R&D activities has resulted in a few key innovations, as follows:
- April 2011, Lingerie material for Victoria’s Secret: In April 2011, Best Pacific’s R&D team developed a material for bras that was granted a patent, and was ultimately selected by Victoria’s Secret for its Body by Victoria’s product line. By developing the material, Best Pacific was able to enter into an exclusivity agreement with Victoria’s Secret to supply the material to its designated OEMs from 2012 to 2014, which laid the foundation for more business.On a separate note, on Best Pacific’s relationship with Victoria’s Secret, according to a CICC December 2016 report, “Best Pacific International became a supplier of the brand [Victoria’s Secret] following a 3-year evaluation of the company’s R&D capabilities, and it now accounts for 50%, 60% and 25% of lingerie material, sportswear material and elastic webbing orders from Victoria’s Secret.” [emphasis mine] This, to some extent, shows the vigour of Victoria’s Secret’s evaluation process and the R&D capability of Best Pacific;
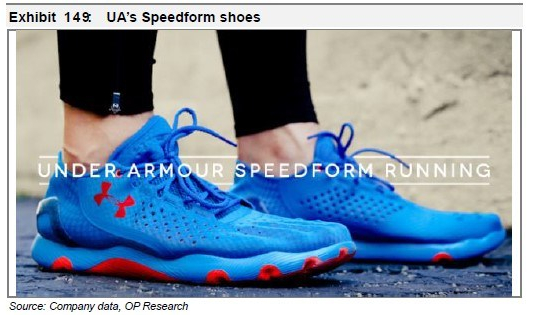
- Mid 2013, Under Armour SpeedForm: In mid 2013, Under Armour launched its star SpeedForm running shoes (featuring flexibility, comfort, lightness and seamlessness) with the slogan “a bra for your feet,” signaling that core manufacturing technology could be shared between intimate wear and high- tier functional sportswear products. Best Pacific (together with Regina Miracle) was selected as the supplier of the cutting-edge materials for those shoes (the same materials that Best Pacific has developed for bras are now also being used in running shoes).A Daiwa 2014 report states that “To draw a parallel, we would compare Under Armour’s SpeedForm to Nike’s Flyknit footwear product, both of which are considered by the market as potential game changers in the footwear industry and as being highly innovative. The fact that Best Pacific beat other much larger and more experienced shoe makers like Yue Yuen to supply the SpeedForm running shoes is a testament to the company’s technological know-how, in our view. While SpeedForm was launched in mid-2013, Best Pacific was still the only supplier of SpeedForm to Under Armour at end-June 2014.” [emphasis mine]A quote from the 2015 Investor Day of Under Armour says it all: “We made shoes in a bra factory because it enabled us to do things that’s never been done before, by the level of fit and comfort that was unmatched and unobtainable in traditional footwear manufacturing facilities.” Best Pacific, joining hands with Regina Miracle, is part of this breakthrough; and
- June 2017, Invista’s Lycra sport PCE (Power-Comfort-Energy) index: It was announced in June 2017 that Best Pacific, and another textile makers (Taiwan-based Eclat Textile), started integrating Lycra Sport’s Power-Comfort-Energy index criteria in their products.“In today’s global-competitive marketplace, innovation alone isn’t enough,” said Huw Williams, Invista’s global segment director, activewear and outdoor. “You also have to be able to clearly and concisely communicate to customers the advantages of fabrics employing a technology like Lycra Sport. That’s what the Power, Comfort and Energy index enables mills to do.”The new fabrics by Best Pacific leverage the recovery performance of Lycra Sport technology and Best Pacific’s high-gauge, double-knit construction to deliver a high stretch modulus that’s well suited for the high-growth active sportswear sectors. Kevin Zan, general manager of Best Pacific’s sports division, said Lycra Sport PCE, launched last year, has been a game changer when it comes to designing, producing, differentiating and selling performance fabrics.One year later, in July 2018, Best Pacific launched a new consumer-centric LYCRA® Bra Fabric Finder™ (BFF) at the Paris Mode City Show to help consumers pick the perfect casual bra. The new “BFF” consumer initiative builds on the original LYCRA® Bra Fabric Finder™ B2B program launched in 2017, which was created by INVISTA to help designers easily identify the best fabric construction and add functionality to any casual bra collection. While the list of participating mills is global, Best Pacific has built the most comprehensive collection of qualified fabrics.
Market & competitors
Lingerie (materials) market
According to a research by Frost & Sullivan, the global lingerie materials market was worth around USD 8.9 billion in 2015, and had been growing at around 5%-6% in the five years leading to that (2011-2015). Meanwhile, the output of China’s lingerie materials market was around RMB 15 billion (or ~USD 2.4b) in 2015, so around 25% of the global market.
Lingerie materials market size
")
")
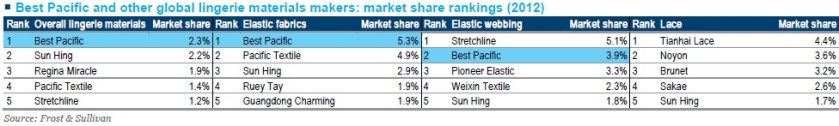
The global lingerie materials market is highly fragmented, with a large number of Chinese and overseas players. The top five lingerie materials maker took up around 9% of the market (as at 2012). Best Pacific is the largest player overall (2.3%) and in elastic fabric (5.3%), and second largest in elastic webbing (3.9%).
Market share of lingerie materials makers, 2012

The lingerie materials industry presents high barrier of entry to new entrants, mainly due to:
- its capital and labour intensive nature, where large-scale investments in fixed assets, raw materials, technology, human resources and cash flow are required to achieve economies of scale. These investments include the capital investments required for setting up a factory and purchasing machineries with new technology, employing and fostering professional, technical and management personnel;
- the high environmental compliance standards – with local and foreign countries attaching high importance to environmental issues, the production process involving emission of wastewater is regulated by government constraints and green barriers set by international purchasers. As a result, significant investments required for facilities to control emission of wastewater and compliance with green standards are also likely to pose difficulties for new entrants; and
- the need to establish operating track record and trust with the customers, where client expansion is difficult for new entrants because it takes time to build trust with customers that demand stringent product quality and such customers have a tendency to purchase from established, qualified and authorised suppliers.
Sportswear market
Sportswear is a large and fast growing market in recent years, due to the trend to be more healthy and exercise more, and the ‘athleisure’ trend. Best Pacific’s 2016 annual report states that “global sportswear market was a supernova in 2016. According to Euromonitor International’s research report, the retail sales value is estimated to show a 7% compound annual growth rate (“CAGR”) from 2016 to 2020, as compared to about a 3.4% CAGR recorded between 2010 and 2015. “One in every six dollars we spend globally on apparel and footwear, we spend on sportswear”, quoted from a Euromonitor International’s research report, which implies the huge potential in the sportswear market and has reaffirmed Best Pacific’s intention to further expand our sportswear business.”
Overall textile market
The overall textile industry has undergone at least two major changes in the 2010s, i.e.:
- manufacturers, both textile and garment, shifting their production bases out from China to other developing countries (e.g. Vietnam and Cambodia), in view of the rising and relatively higher labour costs in China – average monthly wage of USD 700-800 in China vs USD 250-300 in Vietnam (based on a Maybank 2017 report); and
- industry consolidations, due to challenges in the industry, in terms of cost control and more stringent demands for shorter lead time (to cater to the fast changing trends) and better quality of production and materials (higher performance materials with various features), where the companies that are smaller or less efficient that could not adapt got squeezed out.
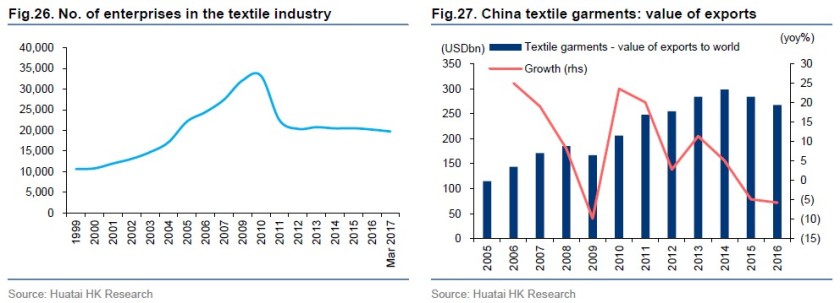
According to a Huatai June 2017 report, “Since 2010, many smaller OEMs have shut down operations due to industry consolidation, caused by the rise in labor cost and stringent requirements from brand owners in areas such as environment protection, child labor and work overtime rules. As of March, there are 19,740 enterprises in the textile industry in China, down 40% from the peak level of 33,218 in 2010. We believe the downward trend will likely persist as OEM manufacturers continue to shift to other locations with cheaper labor costs such as Vietnam and Cambodia. We understand that labor costs in some Southeast Asian countries are 50% lower than in China. Companies that can afford to relocate and those who can survive the industry consolidation are deemed survivors with strong potential to increase capacity and win orders from brand owners.”
China textile industry details
Competitors/market players
There are many players in the textile industry, with different characteristics, for e.g.:
- upstream (yarns) vs mid-stream (fabric) vs down-stream (garment);
- different focus/specialisation in terms of raw materials – natural vs synthetic fibres;
- different production layout (in terms of the geographical bases); and
- different business strategy, for e.g. in terms of customer concentration.
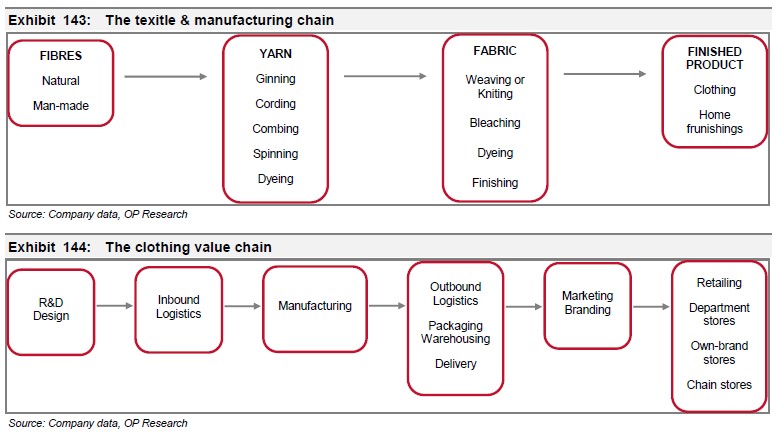
The diagram below provides a good overview of the textile value chain, and where Best Pacific sits in that chain.
Sportswear brands supply chain
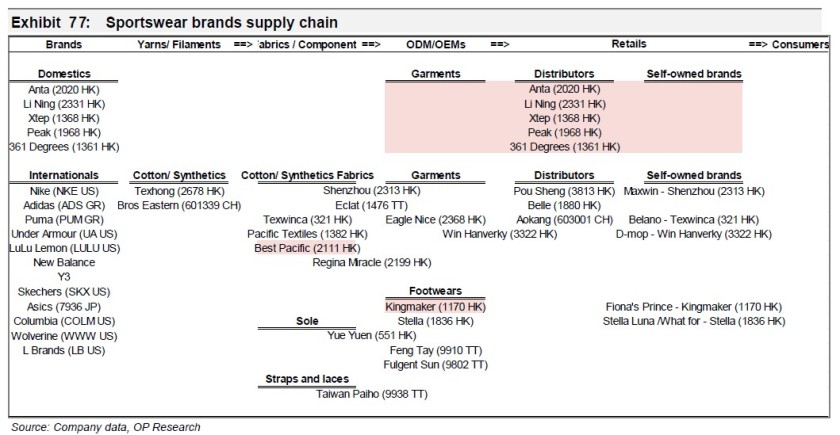
Within this textile value chain, I have a preference for the mid-stream players, as I see it as an area with potentially more companies with moats/ competitive advantages, instead of just a commodity player. Oriental Patron puts it nicely in its 2015 report, stating that “Fabric makers have the edge – We believe the fabric makers are more preferable as they are 1) less labour intensive, 2) more technological know-how is involved, especially in the dyeing process, and 3) less violable to any sudden changes in raw material prices, as they have greater bargaining power to pass on the costs. In fact, we can tell from the gross and net margins from the listed peers. The fabric makers’s average net margins outperformed at 11.8%.”
Textile and manufacturing chain
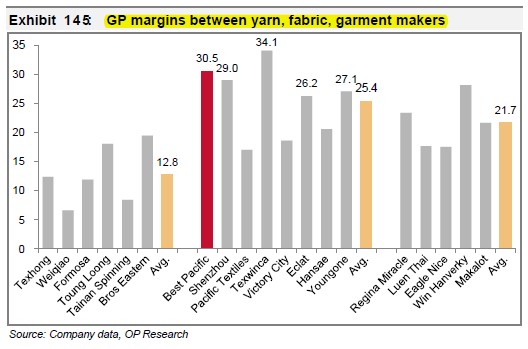
As seen in the chart below, the mid-stream players, or the vertically integrated players (from up- to down-stream) generally have higher gross margins, which are indicative of higher pricing power (and potential ability to extract economic rent).
Gross profit margins of textile makers
In terms of Best Pacific’s competitors, each of the players (including the mid-stream ones) has different charateristics and business dynamics than Best Pacific.
The closest competitor is probably Pacific Textiles, where they both deal with synthetic materials and have quite similar customer segments (both lingerie and sportswear) and production bases. However, Pacific Textile has lower gross margins, high customer concentration (Uniqlo and Victoria’s Secret) and low reinvestment activities (its dividend payout for past few years was 100% or more). More importantly, its annual filings have very limited information which basically make it difficult for me to understand the business and its developments, and I don’t want to own businesses that I can’t understand. However, it would be worthwhile tracking Pacific Textiles since it has some overlapping customers with Best Pacific, a different financial year end (March) and a JV with Brandix which is partnering with Best Pacific currently.
The diagrams below provide more information about the different players and their focus/ strength and customer base.
Details and comparison of textile players
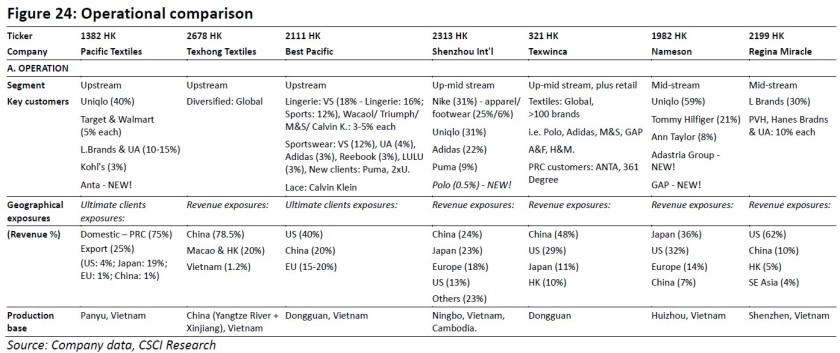
Regina Miracle is in more of the downstream side (albeit an IDM, innovative design manufacturer, which has some high value-adding activities too) and is a close customer of Best Pacific, producing the garments for Victoria’s Secret, Under Armour and other customers (Adidas, Reebok, Calvin Klein, Maniform, Champion, Bali and Warners). It has lower gross profit margins than Best Pacific, even though it is larger (should be the largest bra manufacturer with a ~1% global market share) and also spends more % (~4%)of revenue on R&D, probably due to its lower-margins downstream garment production activities. Even though this company appeals less to me, it is worth monitoring it given that it is a major customer of Best Pacific and shares similar situations with Best Pacific (similar customers and the expansion of production bases in Vietnam at an earlier time than Best Pacific).
Shenzhou International is another interesting player, where it is a very large (around 10x Best Pacific’s size) vertically integrated player with production bases in various locations (China, Vietnam and Cambodia). It has high gross and net profit margins too (comparable gross margins but higher net margins than Best Pacific due to lower operating costs due to a greater customer concentration (90% for Uniqlo, Adidas, Nike and Puma)), with high return on capital. Without having delved deep into Shenzhou International, I am sticking with Best Pacific for now (which I am satisfied with), partly due to its niche position in lingerie market which gives it a very strong hold in that market (Shenzhou does more of sportswear and general apparel, so less innovation involved, but has great advantage due to its vertically integrated model and fast lead time) and smaller size (thus benefiting from a smaller base effect). However, it’s a company worth exploring more in my opinion, as it would most likely benefit a lot from the industry consolidation.
Overall, I don’t see these big, renowned, or quality players as competing strongly with each other, as the industry is highly fragmented. The very weak or weak players would get squeezed out, which provide rooms for growth for the strong players that remain, and given that it takes time to expand and scale up production in this capital- (and for some, labour-) intensive business, there are still room for the strong players to grow in the next few years without having to compete heads-on with each other strongly. Thus, I don’t need to choose the best player, only a good enough player for my standards (this is not a winner-take-all market), that is available for purchase at a good price.
Financials
This sub-section sets out some summary financials of Best Pacific (more are covered later at the relevant places).
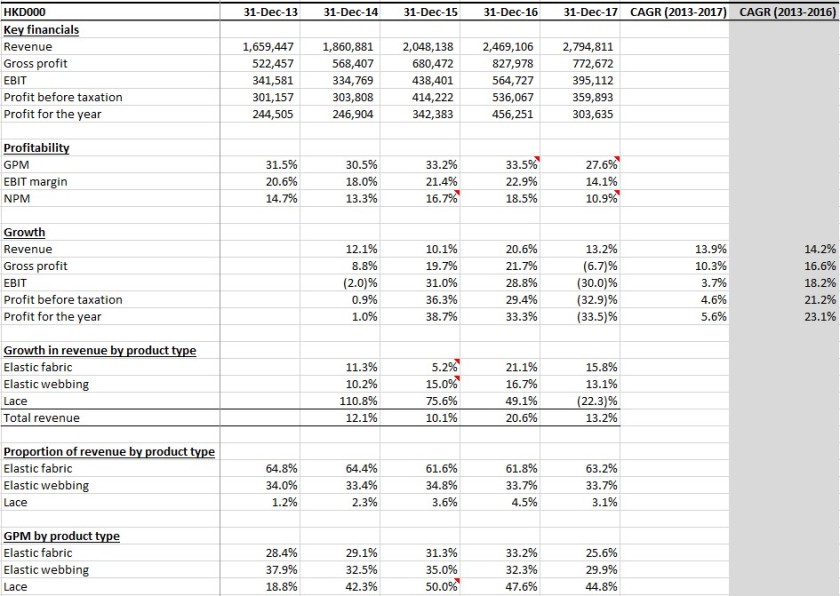
As seen in the table below, over the past four years, from 2013 to 2017:
- revenue has grown relatively consistently at a CAGR of 14%, from HKD 1.7b in 2013 to HKD 2.8b in 2017;
- gross profit has grown at a lower CAGR of 10% and profits at a mediocre CAGR of around 5% – This is mainly due to the underperformance in 2017 in terms of profits, which I consider is an one-off depression in margins due to the start-up phase of expansion in production facilities and operations in Vietnam. The first half of the year saw assets (machineries and plants, amounting to additional ~25% production capacity) and personnel (around 500 people, or 10% increase in total workforce) being built up with no revenues at all (and additional expenses due to hiring and training of personnel and other professional expenses), until the trial production in trial production in July 2017 and official first batch production in 2017Q3;
- GPM and NPM have remained relatively high at ~30% (28%-34%) and ~15% (11%-19%) or more respectively, with lace products commanding the highest GPM (45%-50%), followed by elastic webbing (30%-35%) and elastic fabric (26%-31%); and
- the mix of different product categories has remained relatively stable, with elastic fabric at around two‑third, elastic fabric one-third, and lace minimally at 3%-4%.
Best Pacific’s revenue, profits, profitability and growth
Meanwhile, production capacities have grown faster, at around 20% or more per year during the same period, while number of employees have grown by around 19%, but some of the new capacities and personnel have not been fully utilised yet.
Best Pacific’s operating data
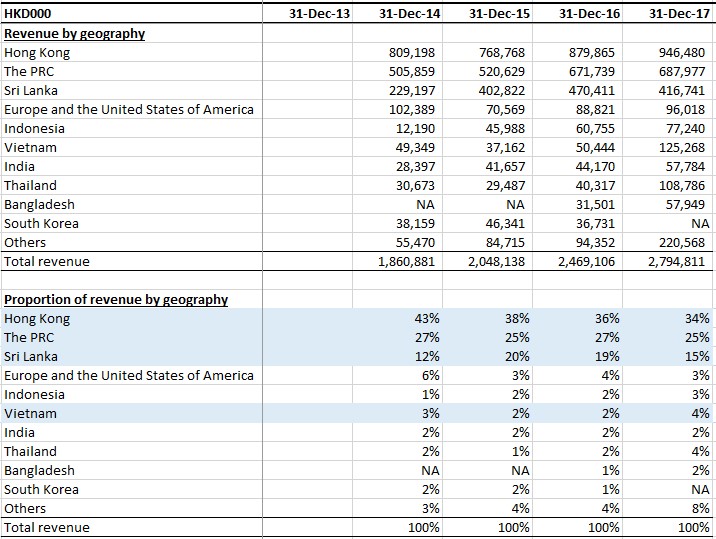
In terms of geographical location of the direct customers (not the location where the end garments are sold to), the top three based on revenues are Hong Kong (declining to 34%), China (stable at ~25%) and Sri Lanka (slight downtrend to 15%).
Best Pacific’s revenue by geography (based on direct customer)
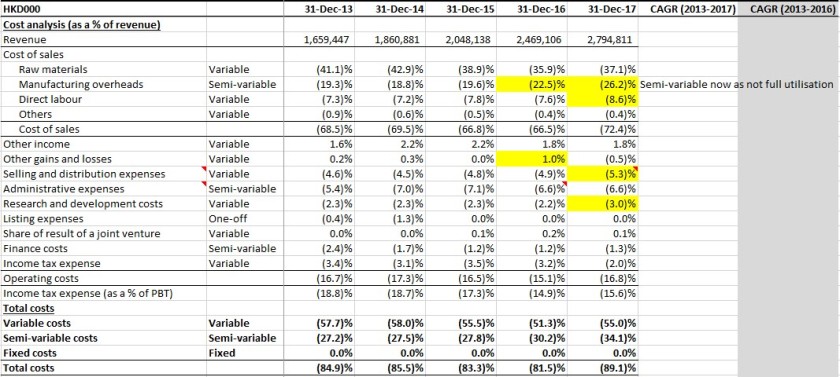
In terms of costs, total costs have been revolving around 80%-90% of revenue in 2013 to 2017, with cost of sales being 67% to 72% and operating costs being 15%-19%. There are some operating leverage for the company to tap on now at this point of time (with production capacities not being fully utilised, especially the new capacities, therefore rendering manufacturing overheads to be more of a semi-fixed nature), because as at 2017:
- variable costs were around 55% of revenue; and
- semi-variable costs were around 34% of revenue (with manufacturing overheads being 26%) (I have not treated any costs as fixed costs, even though they might be, to be conservative in thinking about operating leverage in a growing business context).
Best Pacific’s costs
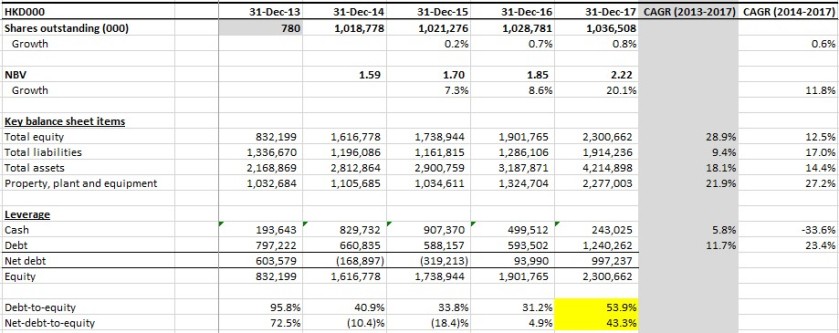
In terms of balance sheet items, from 2014 to 2017 (2013 is not that meaningful as it was before equity raising via IPO and paydown of debt in 2014):
- share base has increased only slightly (due to issuance of some share options) at a CAGR of <1%;
- total equity and net book value has increased at a CAGR of 12%;
- total assets and PPE have increased at a CAGR of 14% and (a much higher) 27% respectively, which shows the substantial expansion in production base; and
- leverage has greatly increased from net cash position in 2014 to 43% net-debt-to-equity in 2017, due to the use of cash and take-up of debt to expand production facilities.
Best Pacific’s summary balance sheet
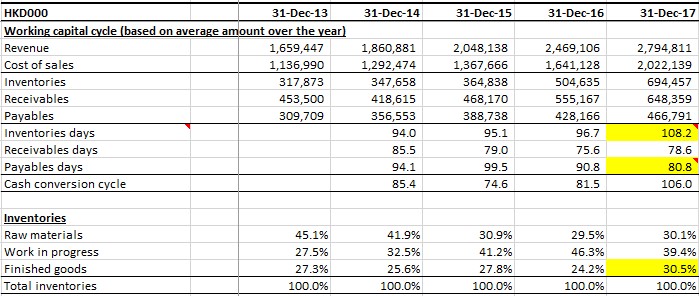
In terms of working capital, the cash conversion cycle has generally been stable, but was squeezed in 2017, due to increase in inventory days (due to brand customers demanding faster lead time, and stock up of inventory due to increased production layout in more locations) and reduction in payable days (to secure better pricing from the suppliers).
Best Pacific’s working capital cycle
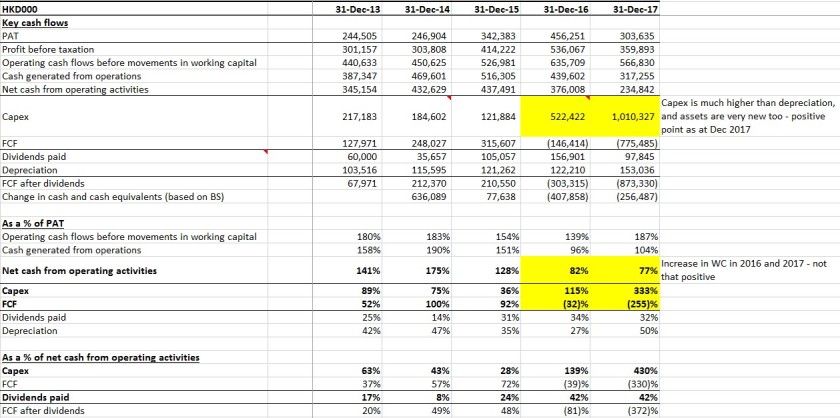
In terms of cash flows:
- quality of earnings have been pretty good, with net cash from operating activities being 130% to 175% of PAT in 2013 to 2015, although this measure dropped to below 100% in 2016 and 2017 due to greater increase in working capital requirements;
- the company has been reinvesting its operating cash flows a lot into capex to expand the business and production facilities, with capex exceeding depreciation by a significant margin (sowing the seeds now and reaping the rewards in a few years time, when capex slows down and goes back to a more reasonable sustainable manner, although not happening in 2018 due to the capex scheduled for Sri Lanka expansion); and
- the company distributes out about half or less of the remaining free cash flows as dividends, at around 25%-35% of PAT (in line with the indicated dividend policy of at least 20% payout), and uses the remaining amounts to build up cash and pay down debt (especially in 2013 to 2015).
Best Pacific’s key cash flows
3. Moat
Overall
A company with high return on capital is unlikely to be able to sustain that high level of return over a long time without a strong and lasting moat, and that is not the type of company that I want to own, hence my focus on moat.
In my view, Best Pacific has two types of moat – (i) a strong moat in terms of intangibles, and (ii) a weak (or less strong) moat in terms of efficient scale.
Intangibles
Best Pacific has the following intangibles which allow it to secure existing and new customers and orders, and extract economic rent or high return on capital:
- close partnership and relationship with both the customers (lingerie and sportswear brands or downstream players (e.g. Regina Miracle)) and the suppliers (synthetic fibre producers) in gathering market intelligence and developing new (innovative) products, e.g. working with:
- Invista since 2003, and launching Lycra Sport PCE index-certified fabrics in mid 2017, and launching a new consumer-centric LYCRA Bra Fabric Finder (BFF) for the designers in July 2018;
- Victoria’s Secret since 2007, and developing a new bra material in April 2011, of which it entered into an exclusive supply arrangement with Victoria’s Secret for three years from 2012 to 2014; and
- Under Armour since 2012, and (together with Regina Miracle) developing and supplying the materials for Under Armour’s star SpeedForm running shoes;
- strong production and R&D capabilities, including track record:
- evidenced by Victoria’s Secret’s selection of it as one of its main supplier (in fact, the largest) after a 3-year evaluation of its R&D capabilities and presumably its quality products, becoming the largest global lingerie materials maker in a short period of 10 years (it was already the largest when it IPO‑ed in 2014), and securing of major global brands including in sportswear despite its new entry; and
- supported by its continuous large spending on modern machineries from European companies (of approximately HKD 0.2m-5.3m per machine, from Karl Mayer and Miller) (with the total PPE now worth HKD 2.3b at end 2017), and substantial spending on R&D (HKD 84m in 2017, or 2%-3% of revenue in the past few years, among the highest in the industry compared with other leading players) with a substantial team (>100 employees, or around 2% of total workforce);
- a pool of innovation and design inventions and patents developed over the years – more than 60, in terms of both design and fabric patents, as at end 2016 (which doubled from the 30 three years ago in end 2013), and substantial amount of new designs every year (200 new designs in 2013); and
- a certain level of branding within the industry, for its quality (and pricier) products – according a Daiwa 2015 report, its “market research with multiple players along the lingerie value chain shows that Best Pacific is known among its peers, suppliers and customers for its high-quality but often pricier fabrics” [emphasis mine].
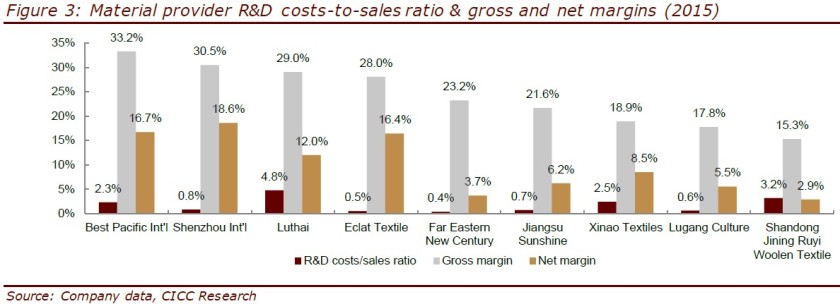
These intangibles (relationship, R&D, product quality, innovations and branding) have allowed Best Pacific to secure existing/new customers and orders, and charged a premium on its products, evidenced by its high gross margin (the highest in 2015 compared to some leading peers), as shown in the figure below.
Leading textile players’ R&D expenses and profit margins
Although Best Pacific has a strong moat in terms of intangibles currently, which is good, it is also important to figure out the moat trend for this moat, i.e. whether it would become stronger, remain the same, or become weaker in the future, say in the next 5 to 10 years.
In my opinion, Best Pacific is still up-ing its game in R&D and innovations, given:
- its active decision to increase R&D spending (a higher 3.0% of a higher revenue in 2017, vs. the previous low 2.2%-2.3%, although this increase was partly driven by demands from the brands side);
- its recent launch of Invista Lycra Sport PCE index-certified fabrics last year (mid 2017) and LYCRA Bra Fabric Finder (BFF) for the designers recently (July 2018) of which it has the most comprehensive collection of qualified fabrics among the participating mills; and
- its recent strategic collaborations with leading downstream players in Sri Lanka (Brandix and MAS) to produce synthetic fabrics;
and therefore I think that this strong intangibles moat of Best Pacific should remain at least as strong, with optionality for an upward improvement.
Efficient scale
Best Pacific has a weak (or less strong) moat in terms of efficient scale in the lingerie segment, where the niche lingerie segment (with a much smaller total addressable market) has not been a focus of the larger textile players which focus more on the general apparel and/ or sportswear segment (with higher growth).
Best Pacific’s focus on this niche lingerie segment in the first decade of its founding has allowed it to become the leading players in the lingerie field, being the world largest lingerie materials maker (albeit still a small 2% to 3% overall market share).
As a result, as of now, Best Pacific is more established than the other players, both in terms of breadth (where it deals with all three major components of a lingerie – elastic fabric, elastic webbings and lace) and depth (know‑how, R&D, capital and PPE investments, and human capital required to run this business well). This presents a strong edge (and opportunities) for Best Pacific, because:
- the new/less established textile players would have to fork out substantial capital and time to grow the lingerie business and build track record and relationship with the lingerie brands, which presents inertia and more challenges to them (as compared to Best Pacific); and
- this allows Best Pacific to leverage its leading position in this lingerie segment, in terms of both breadth and depth/quality, to entrench itself further, secure more orders from existing/new customers and grow its market share, for example by cross-selling its different product categories to existing customers, and offering the solution of a one-stop shop of the major bra components which is valuable in an industry where shorter lead time, consistency in quality and specification (e.g. colour), and ease of procurement (to ensure smooth production/supply chain process) are important.
Market share of lingerie materials makers, 2012
This moat in efficient scale, which led to Best Pacific gaining strong trust and relationship with its lingerie customers, has partly contributed to Best Pacific’s progress in cross-selling its products in the past few years (both within lingerie product categories, and across market segments (lingerie and sportswear)), as discussed in its annual reports:
- 2015: “Benefiting from its strong design capabilities and the strategy to cross sell to existing customers, the Group has started the lace transactions with the majority of its core customers, fully demonstrating the wide recognition and further consolidating the Group’s unique position as a one-stop solutions provider”;
- 2016: “Our one-stop solutions strategy will further benefit the Group from such trend as some of our major lingerie customers are also expanding their businesses into sportswear, creating further cross-selling opportunities for the Group”; and
- 2017: “With the effort of cross-selling of our team and our dedication in expanding our market share, the revenue of elastic webbing also reported an increase by approximately 13.1% to approximately HK$941.6 million during the year under review”.
In my view, given the (i) barriers of entry into the lingerie textile industry, (ii) lack of interest from the larger textile players to participate/compete in this niche segment, and (iii) potential consolidation of the industry due to challenges in terms of cost pressures and stricter lead time requirement from the brands, this efficient scale moat of Best Pacific should also remain at least as strong, with optionality for an upward improvement.
4. Return on capital
Historical return on capital
Best Pacific’s historical return on capital has been generally satisfactory and above my requirement (ROE of at least 15%), albeit it has only a short history of four years in terms of periods post-IPO (in 2014).
As seen in the table below, during the period 2014 to 2017:
- ROA has been around 7% – 14%;
- ROE has been around 13% – 24%, with:
- equity multiplier of 167% – 183%, levered up mainly due to debt and payables (54% and 28% respectively in 2017);
- asset turnover of 66% – 78%, where asset base is mainly PPE, inventories, receivables and cash (54%, 16%, 15% and 6% respectively in 2017);
- net profit margin of 11% – 19% (GPM, EBIT margin and NPM of 28%, 14% and 11% respectively in 2017);
- ROIC has been around 10% – 23%, with:
- invested capital turnover of 80% – 130%; and
- NOPAT margin of 12% to 20%.
Best Pacific’s returns on capital
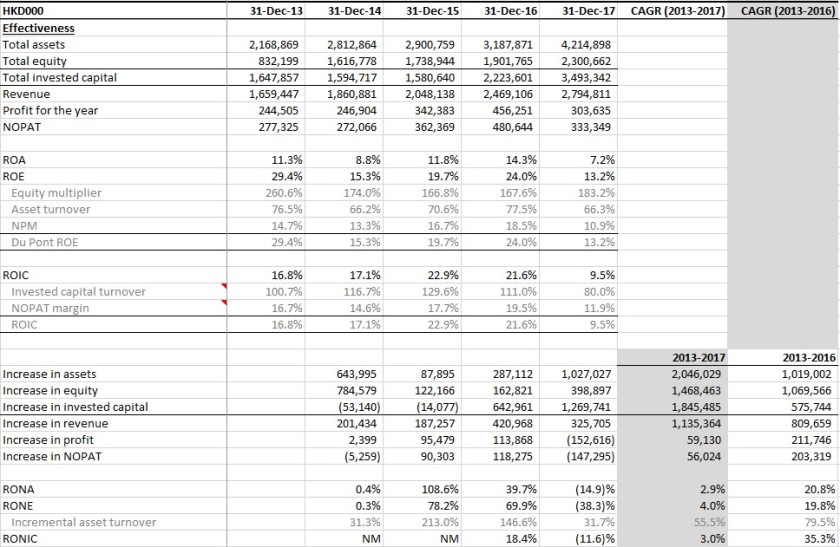
In terms of returns on new capital, from 2013 to 2016 (i.e. excluding 2017 where major expansions were going on, of which the results were not fully shown yet – and depending on the success of execution of those expansions, the returns would be affected accordingly), the CAGR of of the different measures of returns on new capital was very satisfactory, where the CAGR of:
- RONA was 21%;
- RONE was 20%; and
- RONIC was 35%.
Sustainable return on capital
Going forward, I expect that Best Pacific should be able to achieve overall ROE of between 15% to 20% or more. In terms of Du Pont components, I expect:
- equity multiplier to come down to around 160% to 170%, due to paydown of debt and potentially reduction in payables % (if suppliers require shorter payment terms for better prices for Best Pacific);
- asset turnover to recover from the 2017 level of 66% to 71% (average for 2014-2016), as the utilisation for new capacities ramp up; and
- net profit margin to recover from the 2017 level of 11% to at least 16% (average for 2014-2016, which is lower than that for 2015 and 2016 of 17% and 18% respectively), as the depreciation and other manufacturing overheads (included in cost of sales) get spread over a larger volume/ revenue base as new capacities ramp up, and distribution expenses and administrative expenses come down as a % of revenue due to lower transport costs (to customers in Vietnam as there are plants now in Vietnam) and the semi‑fixed nature of administrative expenses coupled with growing revenue.
Based on the above, the ROE would be at least 18% to 19%, with further upside if NPM is greater than 16%.
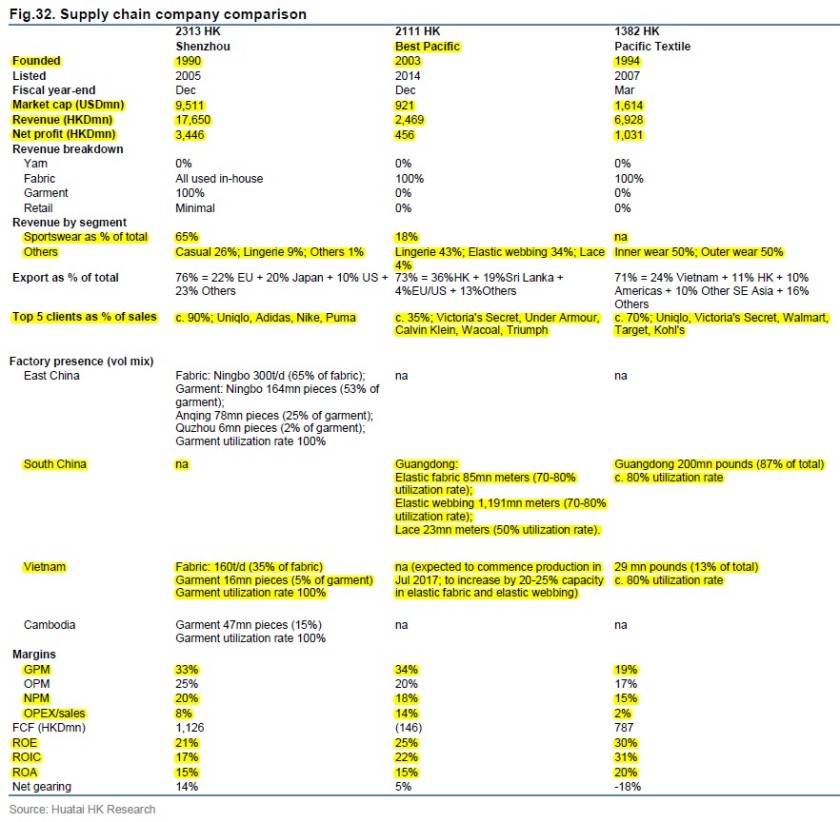
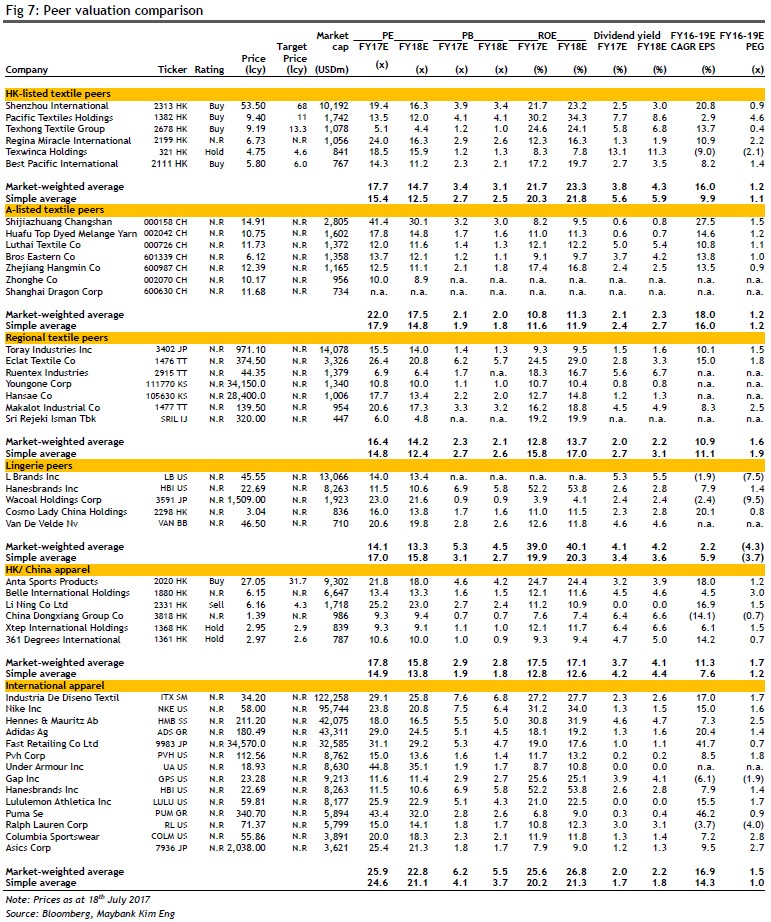
This ROE of 18%-19% is reasonable compared to that achieved by other leading peers (see screenshots below):
- Pacific Textile: 27% in 2014, and 30% in 2017 (estimated); and
- Shenzhou International: 18% in 2014, and 22% in 2017 (estimated).
Details of Best Pacific’s peers
5. Reinvestment opportunities
In my opinion, there are sufficient opportunities for Best Pacific to reinvest its earnings to grow its business, moderately in the mid to high single digit growth rate for the lingerie business, and low to mid teens for the sportswear business.
As indicated earlier:
- according to research by Frost & Sullivan, in 2015, the global and China lingerie materials market was worth around USD 8.9 billion (and had been growing at around 5%-6% in the five years leading to that (2011-2015)) and USD 2.4b respectively, with around 66% of them being the three components that Best Pacific sells (elastic fabric, elastic webbing and lace), so around USD 5.9b and USD 1.6b respectively; and
- according to a Euromonitor International’s research report in 2016, the retail sales value of global sportswear market was estimated to show a 7% CAGR from 2016 to 2020.
To grow, Best Pacific can grow with the whole market which is growing at mid single digits, and take over some market share (including from makers using natural fibres, instead of synthetic fibres) in this consolidating industry (which is possible given Best Pacific’s good or leading position, especially when compared with those inefficient players without much competitive advantages or niche focus that get slowly squeezed out).
Best Pacific’s dividend policy is a minimum of 20% payout ratio and it has been paying out around 15%-35% in the past five years, averaging 27%.
I estimate that Best Pacific would be able to reinvest around 70% or more of its earnings every year for the next five years, and achieve a minimum ROE of 18%, and therefore a growth in net profit of around 13% (= 70% * 18%). Doing some calculations to see what this means:
- Best Pacific earned around HKD 300m (2017) to HKD 450m (2016) in net profits, and I expect a profit level normalised for the start-up activities (on the manufacturing overheads costs) in 2017 to be around HKD 400m (see table below);
- My adjustment of Best Pacific’s 2017 costs and profits
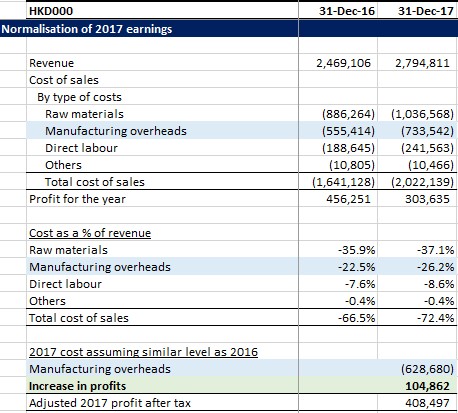
Source: Annual reports. - a reinvestment of 70% resulting in 13% growth means an reinvestment amount of HKD 280m (= HKD 400m * 70%) and increase in net profit of HKD 52m (= HKD 400m * 13%);
- assuming a minimum net profit margin of 15%, the implied increase in revenue is maximum HKD 350m a year (i.e. similar to the increase in sportswear sales alone in 2017 of HKD 340m, or USD 45m); and
- this USD 45m is minimal compared with the USD 6b of total addressable market on the lingerie side (i.e. < 0.1%) and a much larger market for the sportswear side (which uses more length of fabric per garment piece), so this increase in size seems possible and reasonable to me.
6. Management
Details
Best Pacific is mainly run by founder-owner-operators and two family members, as follows:
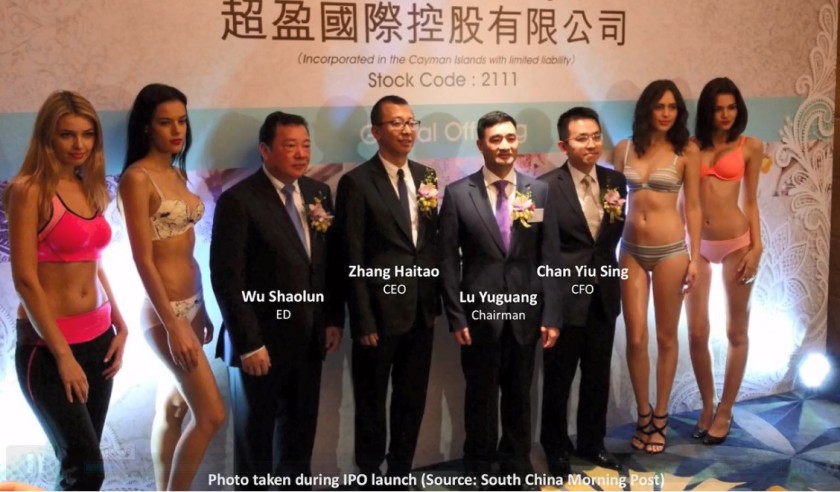
- Lu Yuguang (盧煜光) (52), the co-founder (in 2003) and current executive chairman, who formulates overall management plans and oversees the strategic business development;
- Zhang Haitao (張海濤) (48), the co-founder and current CEO, who formulates and executes overall corporate directions and business strategies;
- Wu Shaolun (吳少倫) (53), Mr. Lu’s brother in-law and the current GM, who is principally responsible for the company’s infrastructure and the general management of Dongguan BPT and Dongguan NHE. Mr. Wu has been with Best Pacific since founding and was given a 5% shareholding in the company by Mr. Lu from his own shares for nil consideration in 2006 in recognition of his contribution to the growth in business; and
- Zheng Tingting (鄭婷婷) (43), Mr. Zhang’s spouse and the current COO and vice-president of marketing, who is responsible for the overall operations, manufacturing and developing and implementing the sales and marketing strategies.
Photo of management team
The screenshots below set out the details of some board members and management team, mainly extracted from company filings (there are not much other publicly available information on them). A few notable points are:
- there are seven board members, i.e. the four executive directors listed above and three independent non-executive directors – Mr. Cheung Yat Ming 張一鳴, Mr. Ding Baoshan 丁寶山, and Mr. Sai Chun Yu 佘振宇;
- the three executive director gentlemen (Mr. Lu, Mr. Zhang and Mr. Wu) have been with the company since founding in 2003, are all textile veteran (even before the founding of the company) with 20+ years of industry experience (starting with either elastic webbing (Mr. Lu, chairman) or elastic fabric (Mr. Zhang, CEO)), and are still at a decent age of around 50 years old;
- Zheng (current VP of marketing) joined the company a few years later in 2006 as a sales manager, and then vice president of marketing and also COO for a certain period, and before that she was a sourcing specialist with a stationery company (Parker Pen (Shanghai) Limited) in 2004-2006;
- the CFO (and company secretary), Mr. Chan Yiu Sing (陳耀星) (39), is a relatively young guy (as compared to the other executives) and is responsible for ensuring and maintaining the standards of corporate governance of the company (note: capital allocation and other strategic financial decision makings are not mentioned in the company filings). He has 12 years of experience in au audit, investment, accounting and finance, and presumably no industry experience;
- the vice-president of R&D, Mr. Shi Jiangzhi (石蒋志) (36), is responsible for leading the efforts to develop innovative technologies in support of the company’s strategic R&D plans. Although he is young, he has been in the textile industry for 17 years, since 2001. He has joined the company since founding, working in various departments and then supervisor and manager of various departments (including planning department), before being promoted to VP of R&D in April 2011. His academic studies (mainly certificate level) were in computer application and then textile engineering (Hunan College of Textile), and electrical maintenance (Labor Bureau in Xiangan City); and
- the executive directors are also involved in and hold positions in various local/regional associations (mainly in Dongguan, where the company is based), as follows:
- Mr. Lu: Since July 2017 and April 2017, Mr. Lu has been appointed as the president of Dongguan City MaChong Association of Enterprises with Foreign Investment (東莞市外商投資企業協會麻涌分會) and as an executive director of World Dongguan Entrepreneurs (世界莞商聯合會) respectively;
- Mr. Zhang: Mr. Zhang has been a director of the Guangdong Textiles Association (廣東省紡織協會) since November 2009 and an individual life member of the Hong Kong General Chamber of Textiles Limited (香港紡織商會) since September 2013; and
- Mr. Wu: Mr. Wu has been a member of the High-tech Enterprises Association in Dongguan City (東莞市高新技術企業協會) since July 2009 and a director of the Dongguan City Association of Enterprises with Foreign Investment (東莞市外商投資企業協會) since November 2013.
Details of board members and management team
")
")
")
")
")
")
Alignment of interest & shareholder friendliness
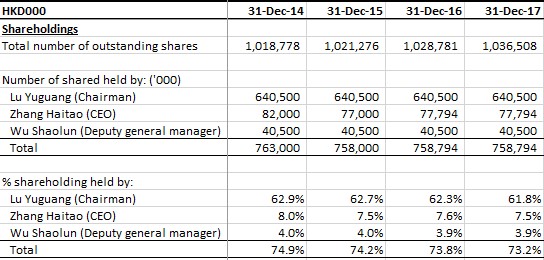
On ownership, the management owns a very large portion of the company of around 73%, with Mr. Lu (the chairman) owning 62% of the company. Thus, the management is aligned with the shareholders as they themselves are large shareholders.
Best Pacific’s management ownership
However, in such cases where the management has very large ownership (of above 50%), the minority shareholders have to be cautious as to whether the management are thinking of and taking care of the minorities well, or are taking advantage of them (due to their executive roles and large control of the company).
In my view, the management is fine in this aspect based on their past behaviour and actions (or at least no red flag stands out to me), and in terms of the use of cash, has been either using the free cash to pay down debt or distributing the excess free cash back to shareholders, in line with the stated dividend policy of minimum 20% payout ratio (and increasing the dividends per share from HKD 8.5 cents in 2014 to HKD 16.8 cents in 2016, albeit dropping to HKD 5.9 cents in 2017 due to the challenging situation that year).
Besides that, in terms of remuneration:
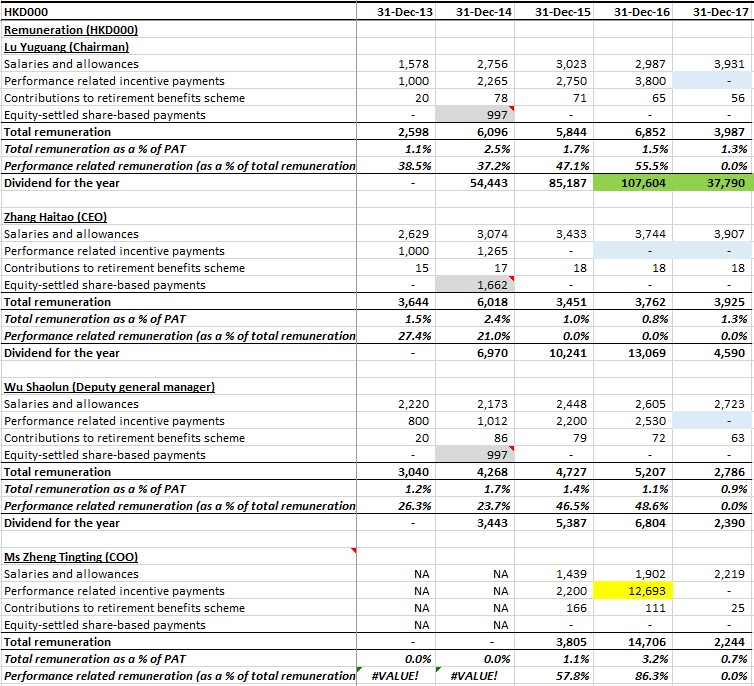
- the management has been paying themselves reasonable amounts of salaries with large performance-based components. For example, in 2014 to 2017, Mr. Lu (the chairman) received total compensation of around HKD 4m to HKD 7m per year, which was 3% to 2.5% of profit after tax for the year, and the performance-based component was around 37% to 56%;
- for the three gentlemen (i.e. excluding Ms. Zheng), the dividends that they received for the year were at most times greater than their remunerations for their executive roles, and especially so for Mr. Lu, where his dividends were 9x to 16x his executive remuneration. This, to me, is a very good point from the perspective of the minority shareholders, because this basically puts Mr. Lu on the same boat with the minority shareholders. If the company does not perform, even though he can still try to pay himself similar levels of executive remuneration, the reduction in the amount of dividends that the company can distribute to him sustainably in the long term would be much larger than what he gets from the executive remuneration;
- in 2017 when the company were hit on gross and net profits, all of the four executive directors were not paid any performance related payments, which effectively reduced their remuneration by around HKD 1m-4m (or around 40% pay cut compared to the previous year for a few of them); and
- Zheng received a very substantial sum of HKD 13m of performance related incentive payments, which was almost 7x her fixed salaries. However, I have not been able to identify what those payments relate to, why they were paid and whether they were reasonable, which may be a cause of concern (especially if this happens again in the future).
Best Pacific’s management’s remuneration
Overall, I feel that the management is aligned with shareholders, mainly due to their large stakes in the company, and have been paying themselves reasonable amount of compensation (and not taking advantage of the minorities).
Capital allocation
In my opinion, the management’s capital allocation behaviour has been decent thus far (albeit only a short operating history of more than four years since IPO), due to the following points:
- the company has indicated and kept the same dividend policy over the years, i.e. minimum 20% payout, and has done so generally (except for 2014) – 25%, 14%, 31%, 34% and 32% in 2013 to 2017 respectively;
- the company has been using its operating cash flows reasonably over the past five years – by first paying down its massive debt accumulated pre-IPO and building up some cash position at the same time in 2013 to 2015, and then gradually increasing its investments in assets (PPE or production facilities, and working capital) to grow the business to cater to increasing demand and opportunities in the market (especially sportswear) and taking up debt where necessary to a reasonable amount in 2016 and 2017; and
- in November 2015, the company made an acquisition of 40% of Charming Elastic (and its subsidiary, Jiangxi Charming Elastic Fabric Wearing Company Limited) that was involved in the manufacturing of elastic webbing in China, and was then slightly loss-making (according to a Oriental Patron 2015 report), from Top Form (a listed underwear garment and a leading brassiere maker, and a top 10 clients of Best Pacific),to increase its production capacities to grow. The company paid HKD 9m-10m for 40% then, and then, in 2017 a further HKD 13m to increase its stakes to 51% upon Charming Elastic meeting the financial performance target.Best Pacific’s share of the post-acquisition profit of Charming Elastic was HKD 5m and HKD 4m in 2016 and 2017 respectively. This translated to an annual ROI of 54% based on the first tranch of investment (= HKD 5m / HKD 9m), and at least 21% based on the total of the two tranches of investment (= (HKD 5m + HKD 4m) / 2 / (HKD 9m + HKD 13m)). The ROI of more than 20% on this investment is, in my opinion, good, and provides some indications of good capital allocation skills of the management (at least in this one case).
One minor whine that I have is that the CFO appears to have less experience (both in terms of years, and in terms of industry experience) than the executive directors and therefore may not be contributing to the capital allocation activities of the company much (although I could be wrong). This probably leaves the executive directors to have to take on this very important task more heavily, although they might not have the relevant financial skills (at least based on their academics) to deal with them well.
7. Risks
Main risks
In my view, the main risks facing Best Pacific include:
- its dependence on its customers’ sales performances, which are subject to changes in trends/fashion that are not easy to predict at times.In Best Pacific’s case, this risk is partly mitigated by its diverse customer base of >300 customers, and lower level of customer concentration of 36% (in terms of revenue) for top 5 customers (as compared to some other leading peers which can have up to 80% or more concentrated on their top 5 customers), which has come down from ~40% in 2014 and 2015 as it acquires more customers.However, its sales to its largest customer, i.e. Victoria’s Secret, still constituted a large portion of total revenue, at around 25% (12% lingerie and 12% sportswear as of 2016), where Victoria’s Secret sourced around half of its supplies (excluding lace materials, which it sourced from others) from Best Pacific. Thus, Best Pacific is subject to some extent to Victoria’s Secret’s sales performance, which has not been good in the past few years, with its same-store comparable sales declining, with it losing market share to others especially to players with more natural-oriented (instead of bombshell-oriented) type of bras (e.g. bralettes) like Aerie (by American Eagle Outfitters, which has been performing very well in the past few years), and with it discontinuing its swimmear product line. Victoria’s Secret’s overall sales growth has turned positive in June 2018 at 1%, although its same store comparable sales (for retail stores) growth are still in the negative 1%-2% region, but its online sales growth has been quite positive (albeit still a small segment).Hopefully, Victoria’s Secret’s sales would start to stabilise more (and recover), and Best Pacific would be able to secure more customers to reduce its exposure to Victoria’s Secret’s sales performance;
- expansion execution risks, where Best Pacific used to operate only in China, but is now expanding to Vietnam and Sri Lanka, locations with different operating environments and where the management might have less operating experiences. Any delay or disruption in production would affect the revenue and profits of the company.For example, Pacific Textile, a competitor of Best Pacific, faced a special unforeseen circumstance for its Vietnam plant, where the operations were interrupted due to the gateway being blocked by villagers for around 9 months, from April 2017 until January 2018, which adversely affected its financial performance for that period.Meanwhile, Regina Miracle, an IDM and a major customer of Best Pacific which built its first Vietnam plant in March 2016 in VSIP (i.e. the same location as Best Pacific), took around two years of smooth operations for its Vietnam production line to start contributing profits. Going with the same timeline, it might take another year for Best Pacific’s Vietnam plant, which started official production in 2017Q3, to start turning in profits (although Best Pacific has higher margins than Regina Miracle, so it might be able to turn in profits earlier).This expansion execution risk is a risk that would affect Best Pacific continuously, even after it manages to run the Vietnam and Sri Lanka plants smoothly in the future. This is because for Best Pacific to grow (which is still the management’s intention right now, unlike Pacific Textile that just distributes out all free cash flows), it would have to continously expand its production facilities and capacities to be able to manufacture and sell more volumes;
- foreign exchange movement risks, where Best Pacific mainly sells in USD and HKD, and incurs costs in RMB, so any appreciation of RMB would have some adverse effects on its profitability. To mitigate this risk, Best Pacific “entered into certain foreign-exchange contracts to pay U.S. dollars and receive RMB” (based on IPO prospectus) and “manages its foreign exchange risk by performing regular reviews and monitoring its foreign exchange exposure. Our finance department will monitor our foreign exchange risk on a continuous basis by analysing our domestic and overseas sales order on hand, expected domestic and overseas orders from customers and estimated foreign currency payment for our purchases. We intend to manage our foreign exchange risks by (i) managing our sales, purchases and expenses denominated in Hong Kong dollars and U.S. dollars through our Hong Kong subsidiaries and managing our sales, purchases and expenses denominated in RMB through our PRC subsidiaries; and (ii) holding cash and bank deposits denominated in RMB primarily by our PRC subsidiaries and cash and bank deposits denominated in Hong Kong and U.S. dollars primarily by our Company and Hong Kong subsidiaries” (based on 2014 report). With the expansion of international production layout in Vietnam and Sri Lanka, this risk should reduce; and
- increasing challenges in the textile industry in general, where the customers (brands) are having greater demands in terms of (shorter) lead time (to cater to the fast fashion trend cycle, and for just-in-time production), lower costs for their raw materials, greater product innovations, etc. This risk should affect more adversely the players that are smaller and do not have any niche, and players that do not have much competitive advantages or moat, and in turn result in industry consolidation with the stronger players (which I think Best Pacific is) staying in the game or emerging stronger. Even then, Best Pacific would have to continuously innovate and produce good quality products to continue to get orders from the customers.
Other minor risks
There are also a few other risks which I deem more minor, as follows:
- fluctuation (or increase) in raw material prices – In my opinion, this affects the upstream players more. Given its cost-plus pricing model, as long as Best Pacific can continue to produce quality and innovative products (through its R&D activities), Best Pacific should be able to pass on most (if not all) of the increase in raw material costs to the customers;
- short operating track record as a public company post-IPO – Best Pacific has only operated for around four years as a public company since its IPO in May 2014, and running a public company well could be slightly different from running a private one well, for e.g. the company is now a larger company, more focused on growth and expansion, and has more financing options to consider;
- interest rate risk – As the company stated in its 2017 report, “With our current reliance on debt financing, the Group expects the overall borrowing costs to increase in 2018. Our management will continue to closely monitor the interest rate exposure and will consider hedging strategies should the need arise”; and
- greater volatility of lace selling price – According to a Daiwa 2014 report, “ASPs and order flow for lace tend to be more volatile than for elastic fabrics and webbing, as demand for lace is more dependent on trends in fashion and design.” This is seen in 2017, where Best Pacific’s lace revenue declined by 22%, due to the market demand for simpler and thinner lace, which commanded a lower unit selling price. However, lace is still a very small segment in terms of revenue (3% in 2017), so this is less of a concern now.
8. Valuation
My valuation
To value Best Pacific (or rather, to estimate a value that I am willing to pay for), I use a simple P/E and EV/NOPAT multiple approach, and consider three main scenarios – conservative, reasonable and optimistic.
I make the following assumptions for my inputs, for the conservative, reasonable and optimistic scenarios respectively:
- PAT: HKD 300m (based on 2017 figure), HKD 400m (based on my estimate as explained earlier to normalise for costs associated with the start-up phase of Vietnam expansion in 2017), and HKD 450m (assuming further improvement in margins from improved operations efficiency and utilisation in Vietnam and improved operating leverage, and the HKD 450m is slightly lower than that achieved in 2016 of HKD 456m);
- NOPAT: HKD 330m (based on 2017 figure), HKD 440m and HKD 490m, of which the latter two are scaled up using the ratios for PAT;
- Expected growth: As explained earlier, ROE of 18% and reinvestment rate of 70%, resulting in expected growth of 13%;
- Multiple: 10x (equivalent to 10% earnings yield and close to 10% FCF yield – Best Pacific’s free cash flow conversion is good, although it may get pressure from working capital side), 13x (i.e. same as expected growth level, going by the logic of Peter Lynch’s PEG, which I firmly believe in) and 16x (if ROE or reinvestment is higher than what I assumed for my main case);
- Net debt (where applicable): HKD 1.0b (based on 2017 figure) for all scenarios; and
- Shares outstanding: 1.0 bilion shares (based on end 2017 figure) for all scenarios.
My valuation of Best Pacific
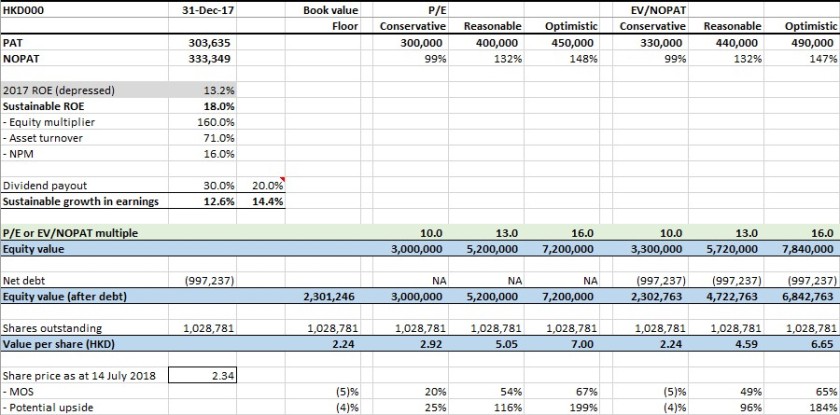
Based on the above, I consider Best Pacific to be worth around HKD 4.50 to HKD 5.00 (based on my reasonable scenarios), with upside to HKD 6.60 to HKD 7.00 if things turn out better. These imply a margin of safety of at least 50% based on the share price of HKD 2.34 as at 14 July 2018.
In the conservative scenarios (which do not incorporate any recovery in financial performance from the start-up phase of Vietnam expansion in 2017, which I consider highly unlikely), Best Pacific is still worth around HKD 2.20 to HKD 2.90, translating to a maximum loss of 5% based on the current price.
This situation can be summed up nicely as a “Heads I win, tails I don’t lose up” type of situation, one favoured by Mohnish Pabrai (a Dhando investor with a concentrated portfolio and impressive track record).
On a separate note, my assumed P/E level is in line with Best Pacific’s historical levels, and lower than its peers’ historical levels (although the peers are larger and have longer histories as public companies).
Best Pacific’s historical P/E levels
")
")
Best Pacific’s peers’ historical P/E levels
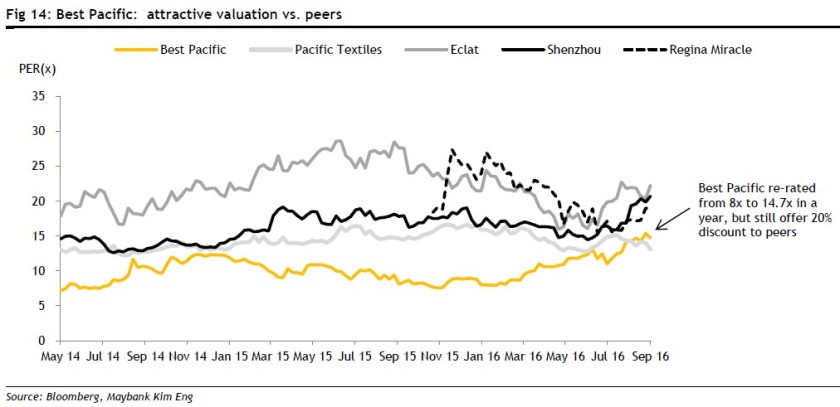
Floor value
There is also an interesting phenomenon which I have observed for Best Pacific. In my opinion, the market sees Best Pacific as a growth or dividend stock, more so the former, and in such cases the market tends to focus on earnings and forget about assets.
The market capitalisation of Best Pacific has dropped to HKD 2,426m (as at 14 July 2018), which is close to its net book value of HKD 2,301m (constituting HKD 4,215m of assets and HKD 1,914m of liabilities). The HKD 4,215m of assets are made up of:
- HKD 2,277m of PPE (of which around HKD 1.0b was new additions in 2017);
- HKD 694m of inventories;
- HKD 648m of trade receivables;
- HKD 243m of cash and cash equivalents; and
- HKD 352m of other assets (HKD 105m of deposits, HKD 103m of prepaid lease payments, HKD 81m of other receivables, deposits and prepayments, and others).
In my opinion, it’s hard to see how a leading textile player (world largest lingerie material maker to top brands, and growing sportswear material maker that has been securing new renowned brands for the past few years), which has spent around HKD 267m on R&D activities (which are not capitalised) in the past five years and produced innovations used by top brands, with more than 15 years of operating history and more than 60 patents (not recognised on is balance sheet), could be worth only its net book value (comprising decent/good quality assets with ROA of above 10%).
Thus, I consider Best Pacific’s net book value of HKD 2,301m or HKD 2.24 per share to form its absolute floor value, which is slightly lower than the current price of HKD 2.34.
As Mike Zapata, a former US Navy SEAL (development group, or more commonly known as the SEAL team 6) member turned fund manager said, “buy on balance sheet, sell on earnings” – in my case, it’s “buy on balance sheet, extract value (as a business owner) from earnings”.
What has the market gotten wrong?
One question worth pondering about (for every investment) is that why I am right, or why the market is wrong. No one knows what the market is pricing in, but my guess is that the market is over-concerned with the expansion activities in Vietnam (and Sri Lanka soon) and the resulting decline in profits in 2017, and potentially any trade wars and economic uncertainties with hot or big money flowing out of Asia back to the U.S. (or elsewhere).
In my view, the market in general tends to not distinguish between uncertainty and risk (which to me is permanent loss of capital), equate the both as same, and discount for them in the security price. This sometimes can present good opportunities for investors who are willing to stomach the uncertainties, especially if those uncertainties do not really pose the same level of risks.
In Best Pacific’s case, I do agree that there are uncertainties, and a certain lower level of risks, involved with the expansions in Vietnam, in the sense that it is not easy to estimate reliably what level of orders, utilisation and improved operating performances can the Vietnam operations achieve, and when. However, I consider all such uncertainties (which do not translate fully into risks) have been priced in, and when all bad things are priced in, the only situation that can unfold is the future is either the same, or positive developments.
9. Concluding thoughts
Overall, I see myself as buying into a good quality business (high ROE and ROIC) with non-excessive leverage (43% net-debt-to-equity now, which should come down in the future) that is swimming with the tide (moderate tailwind in lingerie, and strong tailwind in sportswear) and run by good decent-aged founder-owner-operators who has built this company for more than 15 years (and to the world largest lingerie materials maker (with revenue of HKD 1.7b in 2013) in less than 10 years since founding in 2003, which is an impressive feat to me) with large stakes at play (73% ownership, with dividend payments exceeding the executive remuneration (around 10x or more for Mr. Lu) with substantial performance‑based components) and are still actively thinking about and growing the company for the long term (by going IPO in 2014 and strategically expanding into Vietnam (2017) and Sri Lanka (this and next year), which are long-term initiatives and not short-term goals.
In terms of where I see the business in 5 to 10 years, I see Best Pacific as doubling its overall business in 5-6 years (to revenue of about HKD 6b), with its international production layout maturing and situated close to its customers (lead time is very important) and its R&D team churning out new innovations and sales/marketing team securing new customers for growth and reduction of reliance on Victoria’s Secret, and its sportswear business overtaking its lingerie business (29% vs 71% now) in line with the management’s plans.
In terms of what moves the needles (and hence to monitor), I consider two main things for the long term – first, the ability of Best Pacific to continue to secure more orders from existing and new customers, especially from sportswear, without sacrificing its gross margins; and second, the willingness of the company to continue investing in R&D and its ability to produce new innovations/designs/patents – and one main thing for the short term, i.e. the smooth operations of the Vietnam plant and improvement of its efficiency to levels similar to the China plants.
Note: This is not a recommendation to buy or sell. As with all (value) investments, it’s of utmost importance to do your own due diligence. And as Peter Lynch puts it, “know what you own, and know why you own it”.
Disclosure: The author has long position in Best Pacific as at the time of writing.

Fantastic write-up! What do you think of the report? I would say margins are pressured by being behind the curve of moving production to Vietnam and other countries compared to competition. If they catch up on this part and manage to build production successfully outside China the stock should recover. Also strange they blame currency so much when they supposedly started to hedge..
LikeLike
Thanks Globalstockpicking. After this write-up, I had a one-hour+ call with the investor relations team, and learned that some of the points in my article do not hold up that well. If you are interested, I can email you my notes for the call.
On 2018 H1 results, I was not expecting its profits to recover much, but it came out a bit lower than I thought. However, I am comforted that revenue has still grown compared to H1 last year (it’s down compared to 2017 H2, but H2 usually has higher sales), given that Victoria Secret was still doing quite badly. I think the more important part I want to see for Best Pacific is its ability to continue to secure more orders, get in the revenue, and boost up the utilisation rate. I am less concerned about its profits for now. Although 2018 H1 profits (HKD 103m) are lower than 2017 H1 (HKD 141m) by HKD 38m, if we adjust for the increase in D&A of HKD 44m (HKD 110m vs HKD 66m), 2018 H1 profits had actually increased, and this is before another HKD 7m increase in spending in R&D in 2018 H1.
On moving to Vietnam (and Sri Lanka), I don’t think they are “slow”, as they are facing a different set of situations/context. Best Pacific actually does not benefit much from the lower labour costs there, given that its own factories are highly automated and not that labour intensive. The main reason Best Pacific is moving is because they have to follow their major garment customers, who had just moved and most of the times the brands require their garment suppliers to source their materials locally (regardless of price, quality, etc). Best Pacific also benefits from lower transport costs, but I think the main reason is to be able to fulfill the local sourcing requirement and shorter lead time, which becomes increasingly important. On currency, I haven’t thought much about it and am less concerned about it (in the longer term).
Anyway, have you looked at Best Pacific (or its competitors) before, and any views? On a separate note, I am currently looking at a world leading Japanese industrial robot manufacturer, Fanuc, and am happy to share with you my summary thesis if you are interested. Cheers.
LikeLike